

11. Mass spectra of plant extracts are often spoiled by unwanted
matrix peaks even after selective extraction and chromatographic separation. Try to reduce background signal by
adjusting detection parameters of MS and performing background subtraction with data processing software. For Waters
Xevo TQ-S, for example, background signal can be suppressed
by lowering the gain to 0.1 albeit at the expense of sensitivity.
Matrices may also interfere with detection of your analytes.
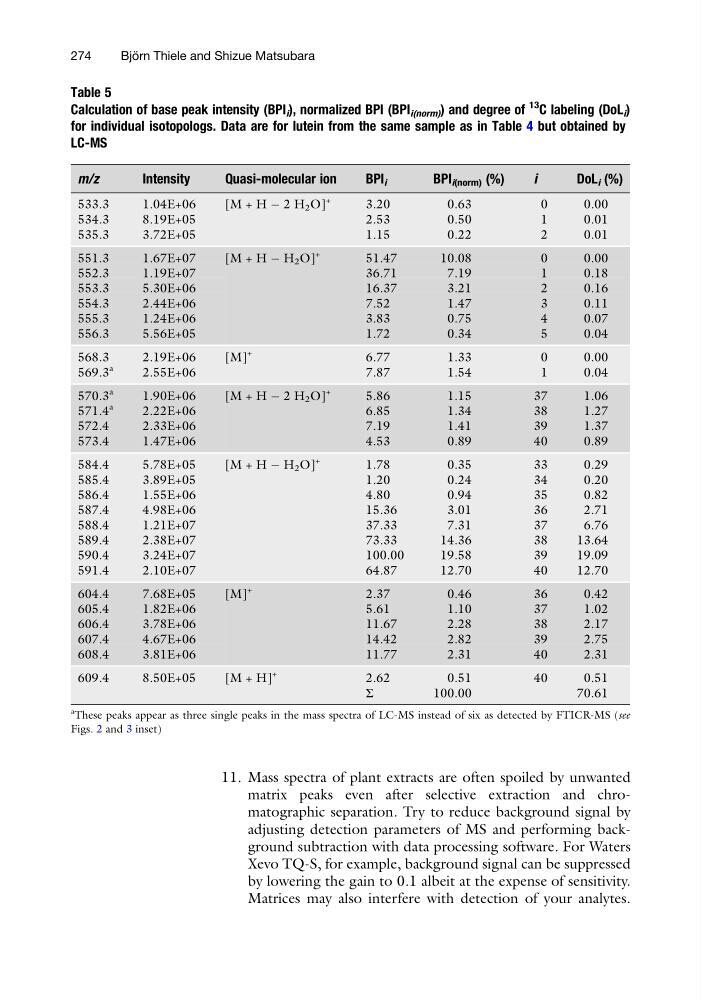
Table 5
Calculation of base peak intensity (BPI i ), normalized BPI (BPI i(norm) ) and degree of
13 C labeling (DoL i )
for individual isotopologs. Data are for lutein from the same sample as in Table 4 but obtained by
LC-MS
m/z
Intensity
Quasi-molecular ion
BPI i
BPI i(norm) (%)
i
DoL i (%)
533.3
1.04E+06
[M + H À 2 H 2 O]
+
3.20
0.63
0
0.00
534.3
8.19E+05
2.53
0.50
1
0.01
535.3
3.72E+05
1.15
0.22
2
0.01
551.3
1.67E+07
[M + H À H 2 O]
+
51.47
10.08
0
0.00
552.3
1.19E+07
36.71
7.19
1
0.18
553.3
5.30E+06
16.37
3.21
2
0.16
554.3
2.44E+06
7.52
1.47
3
0.11
555.3
1.24E+06
3.83
0.75
4
0.07
556.3
5.56E+05
1.72
0.34
5
0.04
568.3
2.19E+06
[M]
+
6.77
1.33
0
0.00
569.3
a
2.55E+06
7.87
1.54
1
0.04
570.3
a
1.90E+06
[M + H À 2 H 2 O]
+
5.86
1.15
37
1.06
571.4
a
2.22E+06
6.85
1.34
38
1.27
572.4
2.33E+06
7.19
1.41
39
1.37
573.4
1.47E+06
4.53
0.89
40
0.89
584.4
5.78E+05
[M + H À H 2 O]
+
1.78
0.35
33
0.29
585.4
3.89E+05
1.20
0.24
34
0.20
586.4
1.55E+06
4.80
0.94
35
0.82
587.4
4.98E+06
15.36
3.01
36
2.71
588.4
1.21E+07
37.33
7.31
37
6.76
589.4
2.38E+07
73.33
14.36
38
13.64
590.4
3.24E+07
100.00
19.58
39
19.09
591.4
2.10E+07
64.87
12.70
40
12.70
604.4
7.68E+05
[M]
+
2.37
0.46
36
0.42
605.4
1.82E+06
5.61
1.10
37
1.02
606.4
3.78E+06
11.67
2.28
38
2.17
607.4
4.67E+06
14.42
2.82
39
2.75
608.4
3.81E+06
11.77
2.31
40
2.31
609.4
8.50E+05
[M + H]
+
2.62
0.51
40
0.51
Σ
100.00
70.61
a
These peaks appear as three single peaks in the mass spectra of LC-MS instead of six as detected by FTICR-MS (see
Figs. 2 and 3 inset)
274
Bjo ¨ rn Thiele and Shizue Matsubara
matrix peaks even after selective extraction and chromatographic separation. Try to reduce background signal by
adjusting detection parameters of MS and performing background subtraction with data processing software. For Waters
Xevo TQ-S, for example, background signal can be suppressed
by lowering the gain to 0.1 albeit at the expense of sensitivity.
Matrices may also interfere with detection of your analytes.
Table 5
Calculation of base peak intensity (BPI i ), normalized BPI (BPI i(norm) ) and degree of
13 C labeling (DoL i )
for individual isotopologs. Data are for lutein from the same sample as in Table 4 but obtained by
LC-MS
m/z
Intensity
Quasi-molecular ion
BPI i
BPI i(norm) (%)
i
DoL i (%)
533.3
1.04E+06
[M + H À 2 H 2 O]
+
3.20
0.63
0
0.00
534.3
8.19E+05
2.53
0.50
1
0.01
535.3
3.72E+05
1.15
0.22
2
0.01
551.3
1.67E+07
[M + H À H 2 O]
+
51.47
10.08
0
0.00
552.3
1.19E+07
36.71
7.19
1
0.18
553.3
5.30E+06
16.37
3.21
2
0.16
554.3
2.44E+06
7.52
1.47
3
0.11
555.3
1.24E+06
3.83
0.75
4
0.07
556.3
5.56E+05
1.72
0.34
5
0.04
568.3
2.19E+06
[M]
+
6.77
1.33
0
0.00
569.3
a
2.55E+06
7.87
1.54
1
0.04
570.3
a
1.90E+06
[M + H À 2 H 2 O]
+
5.86
1.15
37
1.06
571.4
a
2.22E+06
6.85
1.34
38
1.27
572.4
2.33E+06
7.19
1.41
39
1.37
573.4
1.47E+06
4.53
0.89
40
0.89
584.4
5.78E+05
[M + H À H 2 O]
+
1.78
0.35
33
0.29
585.4
3.89E+05
1.20
0.24
34
0.20
586.4
1.55E+06
4.80
0.94
35
0.82
587.4
4.98E+06
15.36
3.01
36
2.71
588.4
1.21E+07
37.33
7.31
37
6.76
589.4
2.38E+07
73.33
14.36
38
13.64
590.4
3.24E+07
100.00
19.58
39
19.09
591.4
2.10E+07
64.87
12.70
40
12.70
604.4
7.68E+05
[M]
+
2.37
0.46
36
0.42
605.4
1.82E+06
5.61
1.10
37
1.02
606.4
3.78E+06
11.67
2.28
38
2.17
607.4
4.67E+06
14.42
2.82
39
2.75
608.4
3.81E+06
11.77
2.31
40
2.31
609.4
8.50E+05
[M + H]
+
2.62
0.51
40
0.51
Σ
100.00
70.61
a
These peaks appear as three single peaks in the mass spectra of LC-MS instead of six as detected by FTICR-MS (see
Figs. 2 and 3 inset)
274
Bjo ¨ rn Thiele and Shizue Matsubara