

6. Export the spectrum list of LC-MS to Excel. Compare the m/z
values of the two lists and delete no-match peaks also from the
LC-MS list. Apply the mass assignment of FTICR-MS to all
spectrum lists of LC-MS.
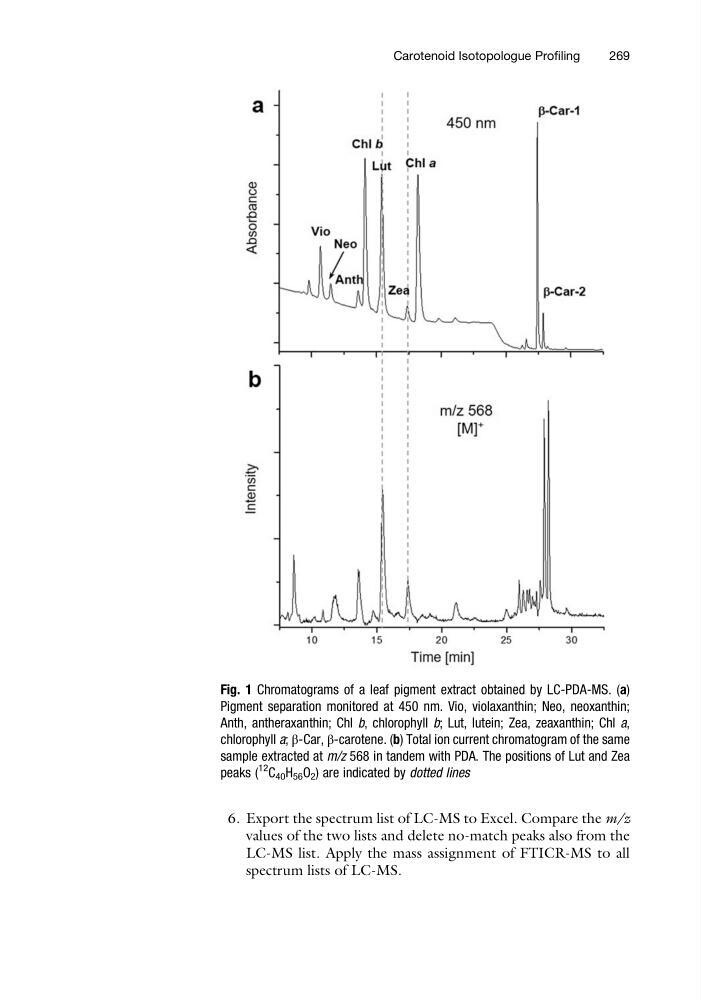
Fig. 1 Chromatograms of a leaf pigment extract obtained by LC-PDA-MS. (a)
Pigment separation monitored at 450 nm. Vio, violaxanthin; Neo, neoxanthin;
Anth, antheraxanthin; Chl b, chlorophyll b; Lut, lutein; Zea, zeaxanthin; Chl a,
chlorophyll a; β-Car, β-carotene. (b) Total ion current chromatogram of the same
sample extracted at m/z 568 in tandem with PDA. The positions of Lut and Zea
peaks (
12 C 40 H 56 O 2 ) are indicated by dotted lines
Carotenoid Isotopologue Profiling
269
values of the two lists and delete no-match peaks also from the
LC-MS list. Apply the mass assignment of FTICR-MS to all
spectrum lists of LC-MS.
Fig. 1 Chromatograms of a leaf pigment extract obtained by LC-PDA-MS. (a)
Pigment separation monitored at 450 nm. Vio, violaxanthin; Neo, neoxanthin;
Anth, antheraxanthin; Chl b, chlorophyll b; Lut, lutein; Zea, zeaxanthin; Chl a,
chlorophyll a; β-Car, β-carotene. (b) Total ion current chromatogram of the same
sample extracted at m/z 568 in tandem with PDA. The positions of Lut and Zea
peaks (
12 C 40 H 56 O 2 ) are indicated by dotted lines
Carotenoid Isotopologue Profiling
269