

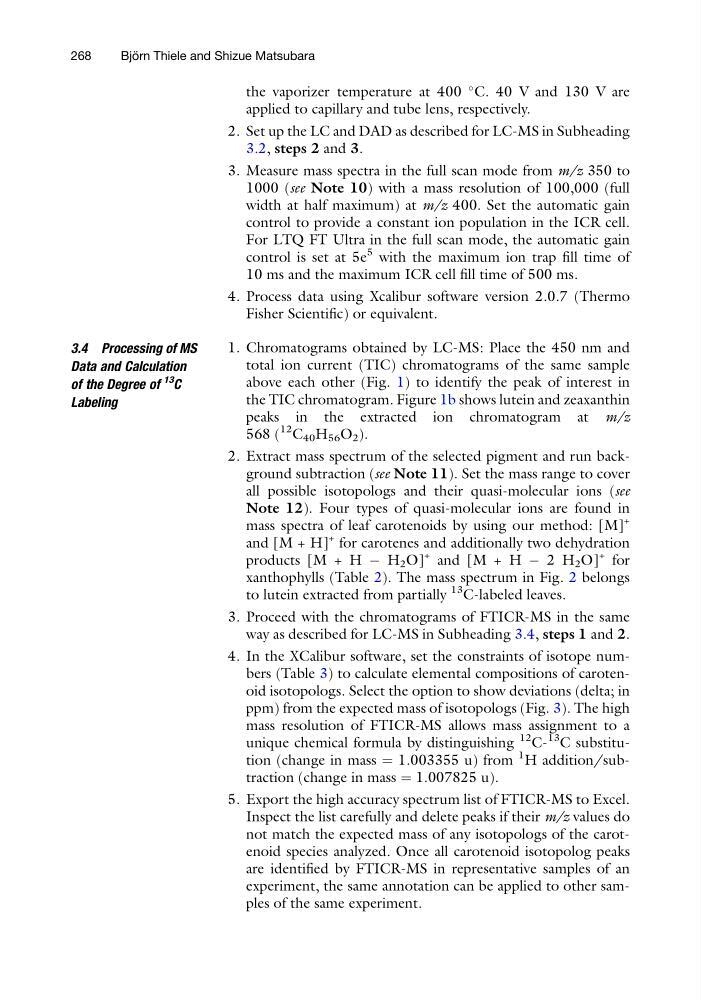
the vaporizer temperature at 400
C. 40 V and 130 V are
applied to capillary and tube lens, respectively.
2. Set up the LC and DAD as described for LC-MS in Subheading
3.2, steps 2 and 3.
3. Measure mass spectra in the full scan mode from m/z 350 to
1000 (see Note 10) with a mass resolution of 100,000 (full
width at half maximum) at m/z 400. Set the automatic gain
control to provide a constant ion population in the ICR cell.
For LTQ FT Ultra in the full scan mode, the automatic gain
control is set at 5e
5 with the maximum ion trap fill time of
10 ms and the maximum ICR cell fill time of 500 ms.
4. Process data using Xcalibur software version 2.0.7 (Thermo
Fisher Scientific) or equivalent.
3.4 Processing of MS
Data and Calculation
of the Degree of
13
C
Labeling
1. Chromatograms obtained by LC-MS: Place the 450 nm and
total ion current (TIC) chromatograms of the same sample
above each other (Fig. 1) to identify the peak of interest in
the TIC chromatogram. Figure 1b shows lutein and zeaxanthin
peaks in the extracted ion chromatogram at m/z
568 (
12
C 40 H 56 O 2 ).
2. Extract mass spectrum of the selected pigment and run background subtraction (see Note 11). Set the mass range to cover
all possible isotopologs and their quasi-molecular ions (see
Note 12). Four types of quasi-molecular ions are found in
mass spectra of leaf carotenoids by using our method: [M]
+
and [M + H]
+ for carotenes and additionally two dehydration
products [M + H À H 2 O]
+ and [M + H À 2 H 2 O]
+ for
xanthophylls (Table 2). The mass spectrum in Fig. 2 belongs
to lutein extracted from partially
13
C-labeled leaves.
3. Proceed with the chromatograms of FTICR-MS in the same
way as described for LC-MS in Subheading 3.4, steps 1 and 2.
4. In the XCalibur software, set the constraints of isotope numbers (Table 3) to calculate elemental compositions of carotenoid isotopologs. Select the option to show deviations (delta; in
ppm) from the expected mass of isotopologs (Fig. 3). The high
mass resolution of FTICR-MS allows mass assignment to a
unique chemical formula by distinguishing
12
C13
C substitution (change in mass ¼ 1.003355 u) from
1 H addition/subtraction (change in mass ¼ 1.007825 u).
5. Export the high accuracy spectrum list of FTICR-MS to Excel.
Inspect the list carefully and delete peaks if their m/z values do
not match the expected mass of any isotopologs of the carotenoid species analyzed. Once all carotenoid isotopolog peaks
are identified by FTICR-MS in representative samples of an
experiment, the same annotation can be applied to other samples of the same experiment.
268
Bjo ¨ rn Thiele and Shizue Matsubara
C. 40 V and 130 V are
applied to capillary and tube lens, respectively.
2. Set up the LC and DAD as described for LC-MS in Subheading
3.2, steps 2 and 3.
3. Measure mass spectra in the full scan mode from m/z 350 to
1000 (see Note 10) with a mass resolution of 100,000 (full
width at half maximum) at m/z 400. Set the automatic gain
control to provide a constant ion population in the ICR cell.
For LTQ FT Ultra in the full scan mode, the automatic gain
control is set at 5e
5 with the maximum ion trap fill time of
10 ms and the maximum ICR cell fill time of 500 ms.
4. Process data using Xcalibur software version 2.0.7 (Thermo
Fisher Scientific) or equivalent.
3.4 Processing of MS
Data and Calculation
of the Degree of
13
C
Labeling
1. Chromatograms obtained by LC-MS: Place the 450 nm and
total ion current (TIC) chromatograms of the same sample
above each other (Fig. 1) to identify the peak of interest in
the TIC chromatogram. Figure 1b shows lutein and zeaxanthin
peaks in the extracted ion chromatogram at m/z
568 (
12
C 40 H 56 O 2 ).
2. Extract mass spectrum of the selected pigment and run background subtraction (see Note 11). Set the mass range to cover
all possible isotopologs and their quasi-molecular ions (see
Note 12). Four types of quasi-molecular ions are found in
mass spectra of leaf carotenoids by using our method: [M]
+
and [M + H]
+ for carotenes and additionally two dehydration
products [M + H À H 2 O]
+ and [M + H À 2 H 2 O]
+ for
xanthophylls (Table 2). The mass spectrum in Fig. 2 belongs
to lutein extracted from partially
13
C-labeled leaves.
3. Proceed with the chromatograms of FTICR-MS in the same
way as described for LC-MS in Subheading 3.4, steps 1 and 2.
4. In the XCalibur software, set the constraints of isotope numbers (Table 3) to calculate elemental compositions of carotenoid isotopologs. Select the option to show deviations (delta; in
ppm) from the expected mass of isotopologs (Fig. 3). The high
mass resolution of FTICR-MS allows mass assignment to a
unique chemical formula by distinguishing
12
C13
C substitution (change in mass ¼ 1.003355 u) from
1 H addition/subtraction (change in mass ¼ 1.007825 u).
5. Export the high accuracy spectrum list of FTICR-MS to Excel.
Inspect the list carefully and delete peaks if their m/z values do
not match the expected mass of any isotopologs of the carotenoid species analyzed. Once all carotenoid isotopolog peaks
are identified by FTICR-MS in representative samples of an
experiment, the same annotation can be applied to other samples of the same experiment.
268
Bjo ¨ rn Thiele and Shizue Matsubara