

the basis of the Product Ion Scan (PIS) experiments carried out
on the various available standards using various collision energies both in positive and negative modes before the MRM
experiments in order to further confirm the reported compounds identifications.
3. After a run is completed, the results are analyzed and quantified. Each peak is automated integrated by the software and
eventually further reviewed by a technologist. Quantification is
done using LabSolution ver. 5.8. software (Shimadzu Japan).
An example with samples of yellow tamarillo fruits analyzed by
the SFE-SFC-MS methodology (Reproduced with permission
from Ref. [18]; Copyright 2018, Elsevier Inc.) is shown in Fig. 3.
It shows the corresponding enlargements of the ion chromatograms obtained in SIM (APCI negative) mode relative to the
detected apocarotenoid zone. Interestingly, in this study nine
apo-carotenoids including also two apocarotenoid fatty acids esters
were detected in less than 6 min including extraction time. Another
example is shown in Fig. 4 with different positions of eccentric
zeaxanthin oxidative cleavages sites leading to different
apo-zeaxanthinals (Reproduced with permission from Ref.[4];
Copyright 2018, American Chemical Society Publications).
3.3 Quantitative
Analysis
Quantitative analysis is performed by the preparation of appropriate
calibration curves when the necessary standards are available; however, the complete carotenoid and apocarotenoid quantifications
are very often challenging due to the lack of reference material and
the high cost of the standards. A possible alternative to perform
quantitative analysis is the calculation of the extraction yield
performing multiple extractions until depletion on the same
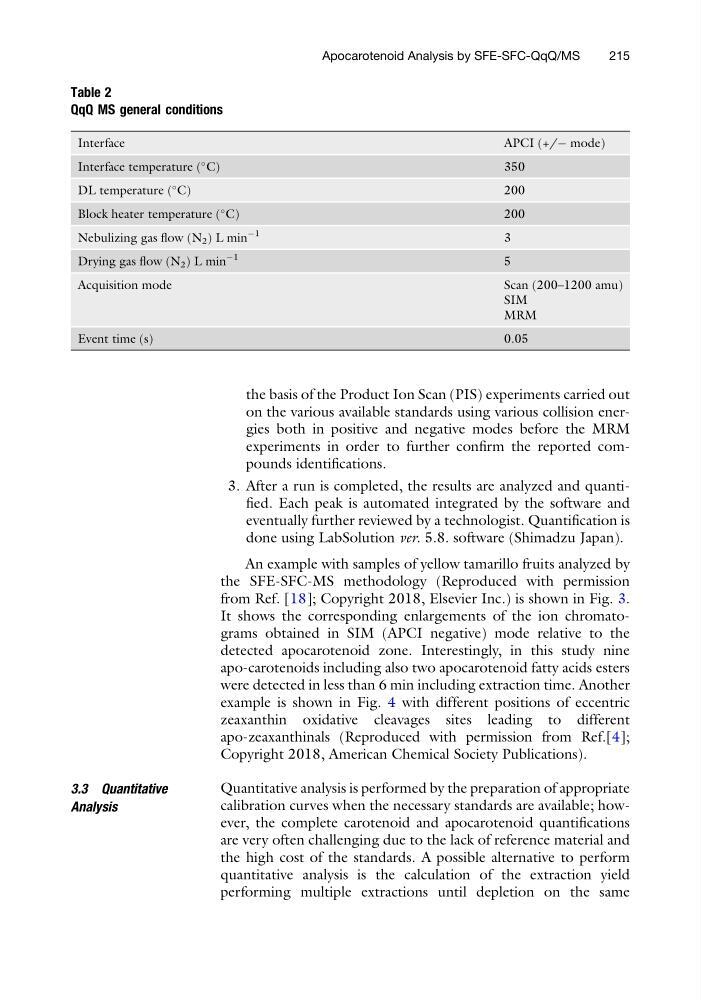
Table 2
QqQ MS general conditions
Interface
APCI (+/À mode)
Interface temperature (
C)
350
DL temperature (
C)
200
Block heater temperature (
C)
200
Nebulizing gas flow (N 2 ) L min
À1
3
Drying gas flow (N 2 ) L min
À1
5
Acquisition mode
Scan (200–1200 amu)
SIM
MRM
Event time (s)
0.05
Apocarotenoid Analysis by SFE-SFC-QqQ/MS
215
on the various available standards using various collision energies both in positive and negative modes before the MRM
experiments in order to further confirm the reported compounds identifications.
3. After a run is completed, the results are analyzed and quantified. Each peak is automated integrated by the software and
eventually further reviewed by a technologist. Quantification is
done using LabSolution ver. 5.8. software (Shimadzu Japan).
An example with samples of yellow tamarillo fruits analyzed by
the SFE-SFC-MS methodology (Reproduced with permission
from Ref. [18]; Copyright 2018, Elsevier Inc.) is shown in Fig. 3.
It shows the corresponding enlargements of the ion chromatograms obtained in SIM (APCI negative) mode relative to the
detected apocarotenoid zone. Interestingly, in this study nine
apo-carotenoids including also two apocarotenoid fatty acids esters
were detected in less than 6 min including extraction time. Another
example is shown in Fig. 4 with different positions of eccentric
zeaxanthin oxidative cleavages sites leading to different
apo-zeaxanthinals (Reproduced with permission from Ref.[4];
Copyright 2018, American Chemical Society Publications).
3.3 Quantitative
Analysis
Quantitative analysis is performed by the preparation of appropriate
calibration curves when the necessary standards are available; however, the complete carotenoid and apocarotenoid quantifications
are very often challenging due to the lack of reference material and
the high cost of the standards. A possible alternative to perform
quantitative analysis is the calculation of the extraction yield
performing multiple extractions until depletion on the same
Table 2
QqQ MS general conditions
Interface
APCI (+/À mode)
Interface temperature (
C)
350
DL temperature (
C)
200
Block heater temperature (
C)
200
Nebulizing gas flow (N 2 ) L min
À1
3
Drying gas flow (N 2 ) L min
À1
5
Acquisition mode
Scan (200–1200 amu)
SIM
MRM
Event time (s)
0.05
Apocarotenoid Analysis by SFE-SFC-QqQ/MS
215