

experimental isotopic patterns, the higher the accuracy of the
predicted match (Fig. 4).
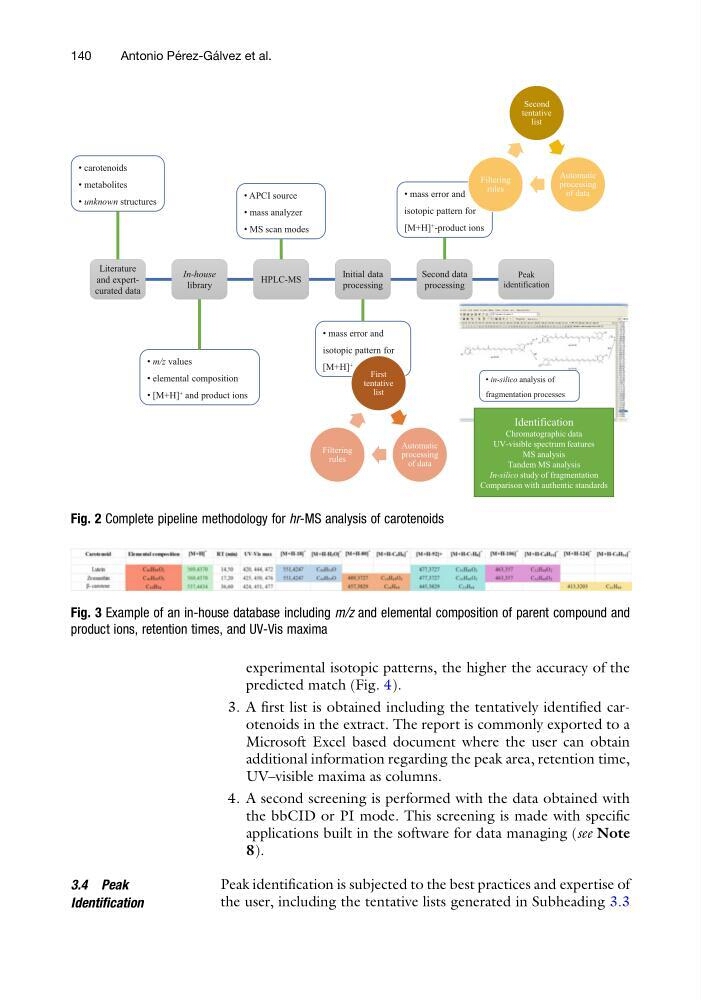
3. A first list is obtained including the tentatively identified carotenoids in the extract. The report is commonly exported to a
Microsoft Excel based document where the user can obtain
additional information regarding the peak area, retention time,
UV–visible maxima as columns.
4. A second screening is performed with the data obtained with
the bbCID or PI mode. This screening is made with specific
applications built in the software for data managing (see Note
8).
3.4 Peak
Identification
Peak identification is subjected to the best practices and expertise of
the user, including the tentative lists generated in Subheading 3.3
Literature
and expertcurated data
• carotenoids
• metabolites
• unknown structures
In-house
library
• m/z values
• elemental composition
• [M+H] + and product ions
HPLC-MS
Initial data
processing
• APCI source
• mass analyzer
• MS scan modes
• mass error and
isotopic pattern for
[M+H] +
First
tentative
list
Automatic
processing
of data
Filtering
rules
Second data
processing
• mass error and
isotopic pattern for
[M+H] + -product ions
Second
tentative
list
Automatic
processing
of data
Filtering
rules
Peak
identification
• in-silico analysis of
fragmentation processes
Identification
Chromatographic data
UV-visible spectrum features
MS analysis
Tandem MS analysis
In-silico study of fragmentation
Comparison with authentic standards
Fig. 2 Complete pipeline methodology for hr-MS analysis of carotenoids
Fig. 3 Example of an in-house database including m/z and elemental composition of parent compound and
product ions, retention times, and UV-Vis maxima
140
Antonio Pe ´ rez-Ga ´ lvez et al.
predicted match (Fig. 4).
3. A first list is obtained including the tentatively identified carotenoids in the extract. The report is commonly exported to a
Microsoft Excel based document where the user can obtain
additional information regarding the peak area, retention time,
UV–visible maxima as columns.
4. A second screening is performed with the data obtained with
the bbCID or PI mode. This screening is made with specific
applications built in the software for data managing (see Note
8).
3.4 Peak
Identification
Peak identification is subjected to the best practices and expertise of
the user, including the tentative lists generated in Subheading 3.3
Literature
and expertcurated data
• carotenoids
• metabolites
• unknown structures
In-house
library
• m/z values
• elemental composition
• [M+H] + and product ions
HPLC-MS
Initial data
processing
• APCI source
• mass analyzer
• MS scan modes
• mass error and
isotopic pattern for
[M+H] +
First
tentative
list
Automatic
processing
of data
Filtering
rules
Second data
processing
• mass error and
isotopic pattern for
[M+H] + -product ions
Second
tentative
list
Automatic
processing
of data
Filtering
rules
Peak
identification
• in-silico analysis of
fragmentation processes
Identification
Chromatographic data
UV-visible spectrum features
MS analysis
Tandem MS analysis
In-silico study of fragmentation
Comparison with authentic standards
Fig. 2 Complete pipeline methodology for hr-MS analysis of carotenoids
Fig. 3 Example of an in-house database including m/z and elemental composition of parent compound and
product ions, retention times, and UV-Vis maxima
140
Antonio Pe ´ rez-Ga ´ lvez et al.