

Characterization Techniques in Nanotechnology …
27
1.3 Energy Dispersive X-ray Spectroscopy
Energy dispersive X-ray spectroscopy (EDS or EDX) is a qualitative, quantitative
and non-destructive chemical microanalytical technique which provides information on the chemical composition of a nanomaterial sample. X-ray emission, the
energy fingerprint of each element, is stimulated by the irradiation of the solid material surface with a high-energy focused X-ray beam (Bergström 2015; Shindo and
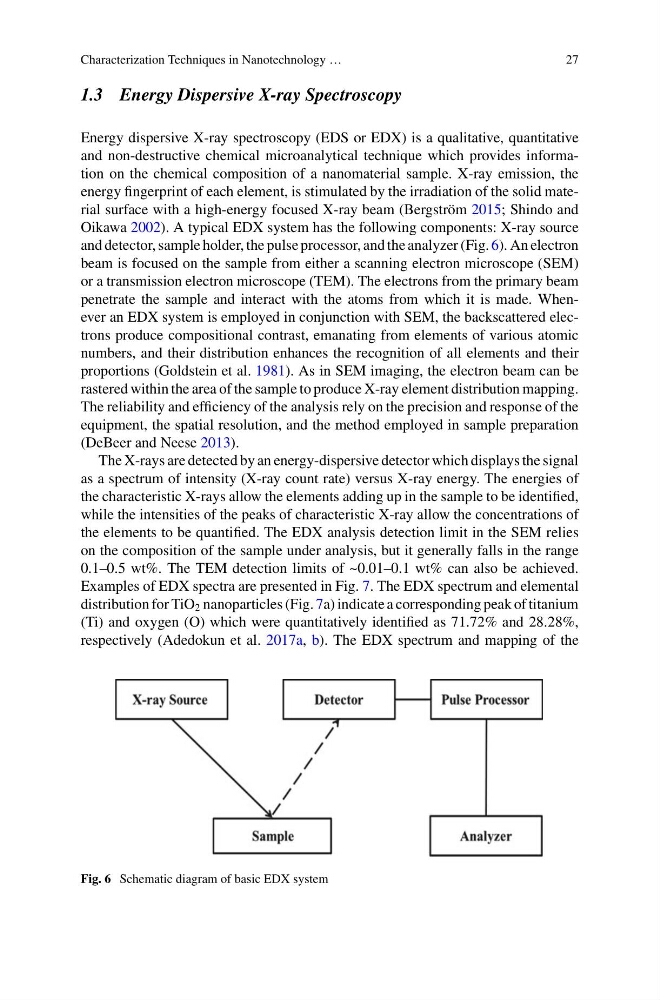
Oikawa 2002). A typical EDX system has the following components: X-ray source
and detector, sample holder, the pulse processor, and the analyzer (Fig. 6). An electron
beam is focused on the sample from either a scanning electron microscope (SEM)
or a transmission electron microscope (TEM). The electrons from the primary beam
penetrate the sample and interact with the atoms from which it is made. Whenever an EDX system is employed in conjunction with SEM, the backscattered electrons produce compositional contrast, emanating from elements of various atomic
numbers, and their distribution enhances the recognition of all elements and their
proportions (Goldstein et al. 1981). As in SEM imaging, the electron beam can be
rastered within the area of the sample to produce X-ray element distribution mapping.
The reliability and efficiency of the analysis rely on the precision and response of the
equipment, the spatial resolution, and the method employed in sample preparation
(DeBeer and Neese 2013).
The X-rays are detected by an energy-dispersive detector which displays the signal
as a spectrum of intensity (X-ray count rate) versus X-ray energy. The energies of
the characteristic X-rays allow the elements adding up in the sample to be identified,
while the intensities of the peaks of characteristic X-ray allow the concentrations of
the elements to be quantified. The EDX analysis detection limit in the SEM relies
on the composition of the sample under analysis, but it generally falls in the range
0.1–0.5 wt%. The TEM detection limits of ~0.01–0.1 wt% can also be achieved.
Examples of EDX spectra are presented in Fig. 7. The EDX spectrum and elemental
distribution for TiO 2 nanoparticles (Fig. 7a) indicate a corresponding peak of titanium
(Ti) and oxygen (O) which were quantitatively identified as 71.72% and 28.28%,
respectively (Adedokun et al. 2017a, b). The EDX spectrum and mapping of the
Fig. 6 Schematic diagram of basic EDX system
27
1.3 Energy Dispersive X-ray Spectroscopy
Energy dispersive X-ray spectroscopy (EDS or EDX) is a qualitative, quantitative
and non-destructive chemical microanalytical technique which provides information on the chemical composition of a nanomaterial sample. X-ray emission, the
energy fingerprint of each element, is stimulated by the irradiation of the solid material surface with a high-energy focused X-ray beam (Bergström 2015; Shindo and
Oikawa 2002). A typical EDX system has the following components: X-ray source
and detector, sample holder, the pulse processor, and the analyzer (Fig. 6). An electron
beam is focused on the sample from either a scanning electron microscope (SEM)
or a transmission electron microscope (TEM). The electrons from the primary beam
penetrate the sample and interact with the atoms from which it is made. Whenever an EDX system is employed in conjunction with SEM, the backscattered electrons produce compositional contrast, emanating from elements of various atomic
numbers, and their distribution enhances the recognition of all elements and their
proportions (Goldstein et al. 1981). As in SEM imaging, the electron beam can be
rastered within the area of the sample to produce X-ray element distribution mapping.
The reliability and efficiency of the analysis rely on the precision and response of the
equipment, the spatial resolution, and the method employed in sample preparation
(DeBeer and Neese 2013).
The X-rays are detected by an energy-dispersive detector which displays the signal
as a spectrum of intensity (X-ray count rate) versus X-ray energy. The energies of
the characteristic X-rays allow the elements adding up in the sample to be identified,
while the intensities of the peaks of characteristic X-ray allow the concentrations of
the elements to be quantified. The EDX analysis detection limit in the SEM relies
on the composition of the sample under analysis, but it generally falls in the range
0.1–0.5 wt%. The TEM detection limits of ~0.01–0.1 wt% can also be achieved.
Examples of EDX spectra are presented in Fig. 7. The EDX spectrum and elemental
distribution for TiO 2 nanoparticles (Fig. 7a) indicate a corresponding peak of titanium
(Ti) and oxygen (O) which were quantitatively identified as 71.72% and 28.28%,
respectively (Adedokun et al. 2017a, b). The EDX spectrum and mapping of the
Fig. 6 Schematic diagram of basic EDX system