

396
A. Amani et al.
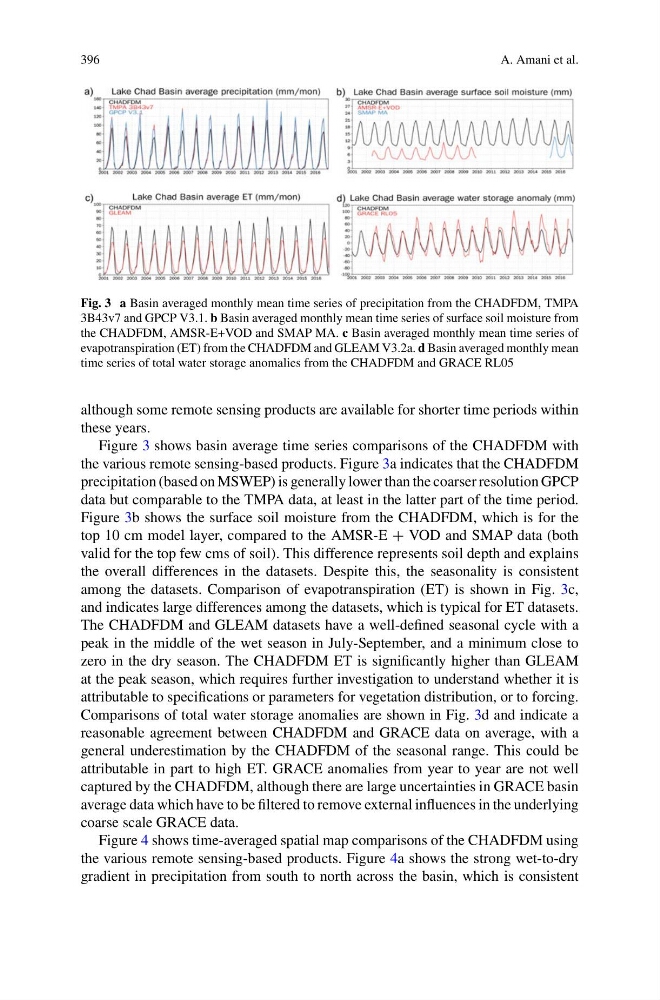
Fig. 3 a Basin averaged monthly mean time series of precipitation from the CHADFDM, TMPA
3B43v7 and GPCP V3.1. b Basin averaged monthly mean time series of surface soil moisture from
the CHADFDM, AMSR-E+VOD and SMAP MA. c Basin averaged monthly mean time series of
evapotranspiration (ET) from the CHADFDM and GLEAM V3.2a. d Basin averaged monthly mean
time series of total water storage anomalies from the CHADFDM and GRACE RL05
although some remote sensing products are available for shorter time periods within
these years.
Figure 3 shows basin average time series comparisons of the CHADFDM with
the various remote sensing-based products. Figure 3a indicates that the CHADFDM
precipitation (based on MSWEP) is generally lower than the coarser resolution GPCP
data but comparable to the TMPA data, at least in the latter part of the time period.
Figure 3b shows the surface soil moisture from the CHADFDM, which is for the
top 10 cm model layer, compared to the AMSR-E + VOD and SMAP data (both
valid for the top few cms of soil). This difference represents soil depth and explains
the overall differences in the datasets. Despite this, the seasonality is consistent
among the datasets. Comparison of evapotranspiration (ET) is shown in Fig. 3c,
and indicates large differences among the datasets, which is typical for ET datasets.
The CHADFDM and GLEAM datasets have a well-defined seasonal cycle with a
peak in the middle of the wet season in July-September, and a minimum close to
zero in the dry season. The CHADFDM ET is significantly higher than GLEAM
at the peak season, which requires further investigation to understand whether it is
attributable to specifications or parameters for vegetation distribution, or to forcing.
Comparisons of total water storage anomalies are shown in Fig. 3d and indicate a
reasonable agreement between CHADFDM and GRACE data on average, with a
general underestimation by the CHADFDM of the seasonal range. This could be
attributable in part to high ET. GRACE anomalies from year to year are not well
captured by the CHADFDM, although there are large uncertainties in GRACE basin
average data which have to be filtered to remove external influences in the underlying
coarse scale GRACE data.
Figure 4 shows time-averaged spatial map comparisons of the CHADFDM using
the various remote sensing-based products. Figure 4a shows the strong wet-to-dry
gradient in precipitation from south to north across the basin, which is consistent
A. Amani et al.
Fig. 3 a Basin averaged monthly mean time series of precipitation from the CHADFDM, TMPA
3B43v7 and GPCP V3.1. b Basin averaged monthly mean time series of surface soil moisture from
the CHADFDM, AMSR-E+VOD and SMAP MA. c Basin averaged monthly mean time series of
evapotranspiration (ET) from the CHADFDM and GLEAM V3.2a. d Basin averaged monthly mean
time series of total water storage anomalies from the CHADFDM and GRACE RL05
although some remote sensing products are available for shorter time periods within
these years.
Figure 3 shows basin average time series comparisons of the CHADFDM with
the various remote sensing-based products. Figure 3a indicates that the CHADFDM
precipitation (based on MSWEP) is generally lower than the coarser resolution GPCP
data but comparable to the TMPA data, at least in the latter part of the time period.
Figure 3b shows the surface soil moisture from the CHADFDM, which is for the
top 10 cm model layer, compared to the AMSR-E + VOD and SMAP data (both
valid for the top few cms of soil). This difference represents soil depth and explains
the overall differences in the datasets. Despite this, the seasonality is consistent
among the datasets. Comparison of evapotranspiration (ET) is shown in Fig. 3c,
and indicates large differences among the datasets, which is typical for ET datasets.
The CHADFDM and GLEAM datasets have a well-defined seasonal cycle with a
peak in the middle of the wet season in July-September, and a minimum close to
zero in the dry season. The CHADFDM ET is significantly higher than GLEAM
at the peak season, which requires further investigation to understand whether it is
attributable to specifications or parameters for vegetation distribution, or to forcing.
Comparisons of total water storage anomalies are shown in Fig. 3d and indicate a
reasonable agreement between CHADFDM and GRACE data on average, with a
general underestimation by the CHADFDM of the seasonal range. This could be
attributable in part to high ET. GRACE anomalies from year to year are not well
captured by the CHADFDM, although there are large uncertainties in GRACE basin
average data which have to be filtered to remove external influences in the underlying
coarse scale GRACE data.
Figure 4 shows time-averaged spatial map comparisons of the CHADFDM using
the various remote sensing-based products. Figure 4a shows the strong wet-to-dry
gradient in precipitation from south to north across the basin, which is consistent