

17 Strengthening Flood and Drought Risk Management Tools …
397
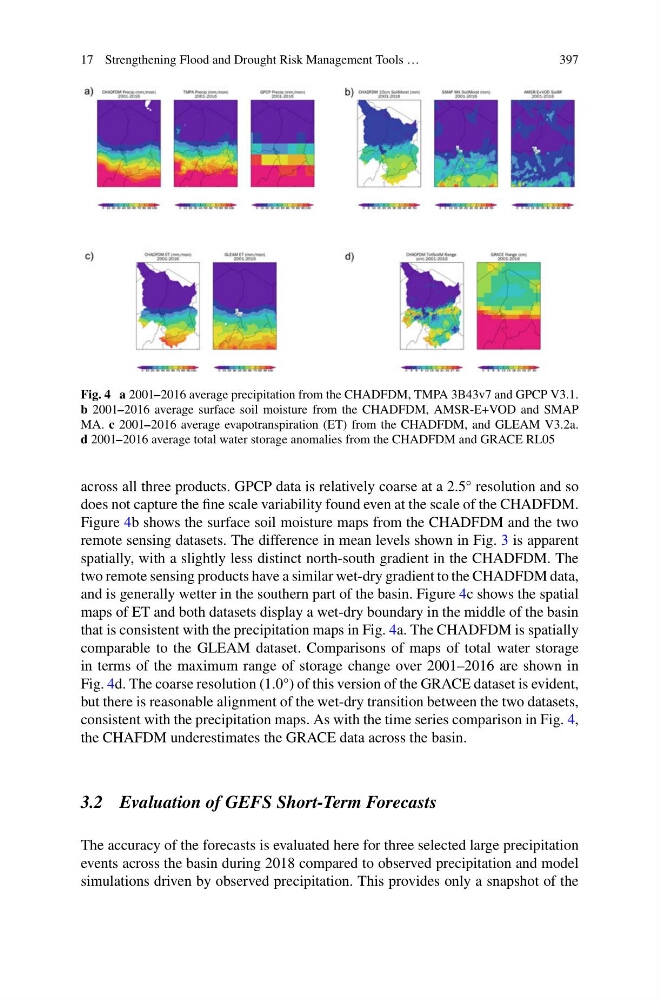
Fig. 4 a 2001–2016 average precipitation from the CHADFDM, TMPA 3B43v7 and GPCP V3.1.
b 2001–2016 average surface soil moisture from the CHADFDM, AMSR-E+VOD and SMAP
MA. c 2001–2016 average evapotranspiration (ET) from the CHADFDM, and GLEAM V3.2a.
d 2001–2016 average total water storage anomalies from the CHADFDM and GRACE RL05
across all three products. GPCP data is relatively coarse at a 2.5° resolution and so
does not capture the fine scale variability found even at the scale of the CHADFDM.
Figure 4b shows the surface soil moisture maps from the CHADFDM and the two
remote sensing datasets. The difference in mean levels shown in Fig. 3 is apparent
spatially, with a slightly less distinct north-south gradient in the CHADFDM. The
two remote sensing products have a similar wet-dry gradient to the CHADFDM data,
and is generally wetter in the southern part of the basin. Figure 4c shows the spatial
maps of ET and both datasets display a wet-dry boundary in the middle of the basin
that is consistent with the precipitation maps in Fig. 4a. The CHADFDM is spatially
comparable to the GLEAM dataset. Comparisons of maps of total water storage
in terms of the maximum range of storage change over 2001–2016 are shown in
Fig. 4d. The coarse resolution (1.0°) of this version of the GRACE dataset is evident,
but there is reasonable alignment of the wet-dry transition between the two datasets,
consistent with the precipitation maps. As with the time series comparison in Fig. 4,
the CHAFDM underestimates the GRACE data across the basin.
3.2 Evaluation of GEFS Short-Term Forecasts
The accuracy of the forecasts is evaluated here for three selected large precipitation
events across the basin during 2018 compared to observed precipitation and model
simulations driven by observed precipitation. This provides only a snapshot of the
397
Fig. 4 a 2001–2016 average precipitation from the CHADFDM, TMPA 3B43v7 and GPCP V3.1.
b 2001–2016 average surface soil moisture from the CHADFDM, AMSR-E+VOD and SMAP
MA. c 2001–2016 average evapotranspiration (ET) from the CHADFDM, and GLEAM V3.2a.
d 2001–2016 average total water storage anomalies from the CHADFDM and GRACE RL05
across all three products. GPCP data is relatively coarse at a 2.5° resolution and so
does not capture the fine scale variability found even at the scale of the CHADFDM.
Figure 4b shows the surface soil moisture maps from the CHADFDM and the two
remote sensing datasets. The difference in mean levels shown in Fig. 3 is apparent
spatially, with a slightly less distinct north-south gradient in the CHADFDM. The
two remote sensing products have a similar wet-dry gradient to the CHADFDM data,
and is generally wetter in the southern part of the basin. Figure 4c shows the spatial
maps of ET and both datasets display a wet-dry boundary in the middle of the basin
that is consistent with the precipitation maps in Fig. 4a. The CHADFDM is spatially
comparable to the GLEAM dataset. Comparisons of maps of total water storage
in terms of the maximum range of storage change over 2001–2016 are shown in
Fig. 4d. The coarse resolution (1.0°) of this version of the GRACE dataset is evident,
but there is reasonable alignment of the wet-dry transition between the two datasets,
consistent with the precipitation maps. As with the time series comparison in Fig. 4,
the CHAFDM underestimates the GRACE data across the basin.
3.2 Evaluation of GEFS Short-Term Forecasts
The accuracy of the forecasts is evaluated here for three selected large precipitation
events across the basin during 2018 compared to observed precipitation and model
simulations driven by observed precipitation. This provides only a snapshot of the