

382
K. M. AbuZeid
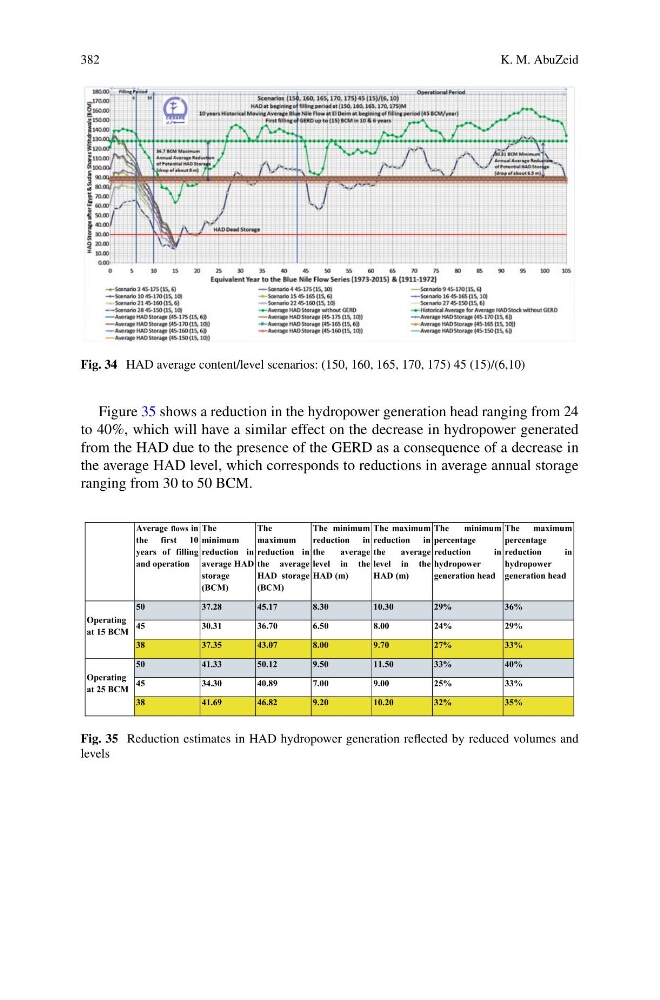
Fig. 34 HAD average content/level scenarios: (150, 160, 165, 170, 175) 45 (15)/(6,10)
Figure 35 shows a reduction in the hydropower generation head ranging from 24
to 40%, which will have a similar effect on the decrease in hydropower generated
from the HAD due to the presence of the GERD as a consequence of a decrease in
the average HAD level, which corresponds to reductions in average annual storage
ranging from 30 to 50 BCM.
Average flows in
the first 10
years of filling
and operation
The
minimum
reduction in
average HAD
storage
(BCM)
The
maximum
reduction in
the average
HAD storage
(BCM)
The minimum
reduction in
the
average
level in the
HAD (m)
The maximum
reduction in
the
average
level in the
HAD (m)
The
minimum
percentage
reduction
in
hydropower
generation head
The
maximum
percentage
reduction
in
hydropower
generation head
Operating
at 15 BCM
50
37.28
45.17
8.30
10.30
29%
36%
45
30.31
36.70
6.50
8.00
24%
29%
38
37.35
43.07
8.00
9.70
27%
33%
Operating
at 25 BCM
50
41.33
50.12
9.50
11.50
33%
40%
45
34.30
40.89
7.00
9.00
25%
33%
38
41.69
46.82
9.20
10.20
32%
35%
Fig. 35 Reduction estimates in HAD hydropower generation reflected by reduced volumes and
levels
K. M. AbuZeid
Fig. 34 HAD average content/level scenarios: (150, 160, 165, 170, 175) 45 (15)/(6,10)
Figure 35 shows a reduction in the hydropower generation head ranging from 24
to 40%, which will have a similar effect on the decrease in hydropower generated
from the HAD due to the presence of the GERD as a consequence of a decrease in
the average HAD level, which corresponds to reductions in average annual storage
ranging from 30 to 50 BCM.
Average flows in
the first 10
years of filling
and operation
The
minimum
reduction in
average HAD
storage
(BCM)
The
maximum
reduction in
the average
HAD storage
(BCM)
The minimum
reduction in
the
average
level in the
HAD (m)
The maximum
reduction in
the
average
level in the
HAD (m)
The
minimum
percentage
reduction
in
hydropower
generation head
The
maximum
percentage
reduction
in
hydropower
generation head
Operating
at 15 BCM
50
37.28
45.17
8.30
10.30
29%
36%
45
30.31
36.70
6.50
8.00
24%
29%
38
37.35
43.07
8.00
9.70
27%
33%
Operating
at 25 BCM
50
41.33
50.12
9.50
11.50
33%
40%
45
34.30
40.89
7.00
9.00
25%
33%
38
41.69
46.82
9.20
10.20
32%
35%
Fig. 35 Reduction estimates in HAD hydropower generation reflected by reduced volumes and
levels