

16 Potential Transboundary Impacts of the Grand Ethiopian …
381
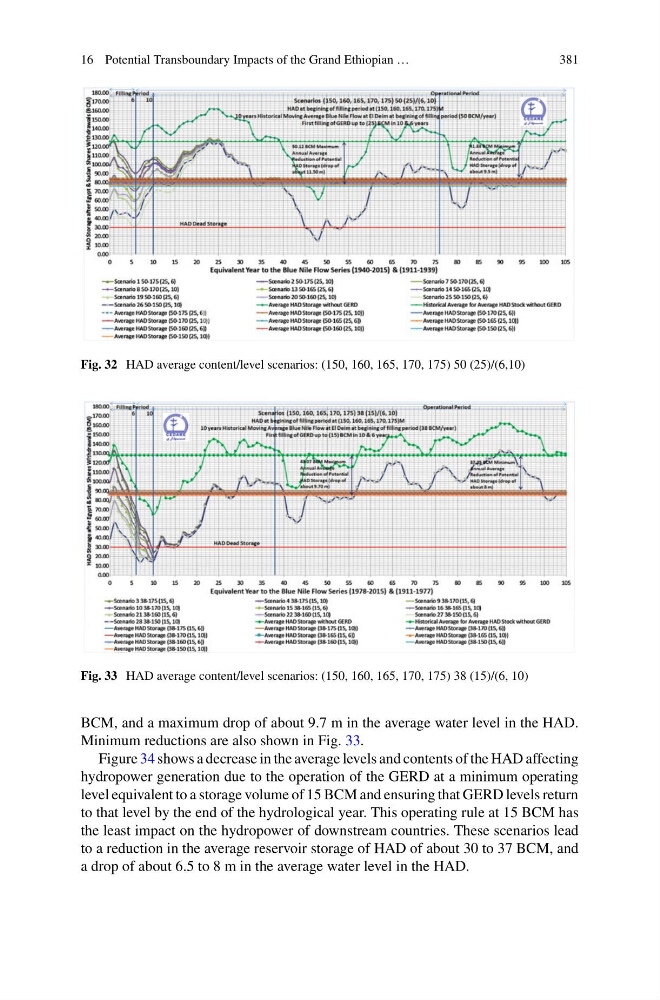
Fig. 32 HAD average content/level scenarios: (150, 160, 165, 170, 175) 50 (25)/(6,10)
Fig. 33 HAD average content/level scenarios: (150, 160, 165, 170, 175) 38 (15)/(6, 10)
BCM, and a maximum drop of about 9.7 m in the average water level in the HAD.
Minimum reductions are also shown in Fig. 33.
Figure 34 shows a decrease in the average levels and contents of the HAD affecting
hydropower generation due to the operation of the GERD at a minimum operating
level equivalent to a storage volume of 15 BCM and ensuring that GERD levels return
to that level by the end of the hydrological year. This operating rule at 15 BCM has
the least impact on the hydropower of downstream countries. These scenarios lead
to a reduction in the average reservoir storage of HAD of about 30 to 37 BCM, and
a drop of about 6.5 to 8 m in the average water level in the HAD.
381
Fig. 32 HAD average content/level scenarios: (150, 160, 165, 170, 175) 50 (25)/(6,10)
Fig. 33 HAD average content/level scenarios: (150, 160, 165, 170, 175) 38 (15)/(6, 10)
BCM, and a maximum drop of about 9.7 m in the average water level in the HAD.
Minimum reductions are also shown in Fig. 33.
Figure 34 shows a decrease in the average levels and contents of the HAD affecting
hydropower generation due to the operation of the GERD at a minimum operating
level equivalent to a storage volume of 15 BCM and ensuring that GERD levels return
to that level by the end of the hydrological year. This operating rule at 15 BCM has
the least impact on the hydropower of downstream countries. These scenarios lead
to a reduction in the average reservoir storage of HAD of about 30 to 37 BCM, and
a drop of about 6.5 to 8 m in the average water level in the HAD.