

372
K. M. AbuZeid
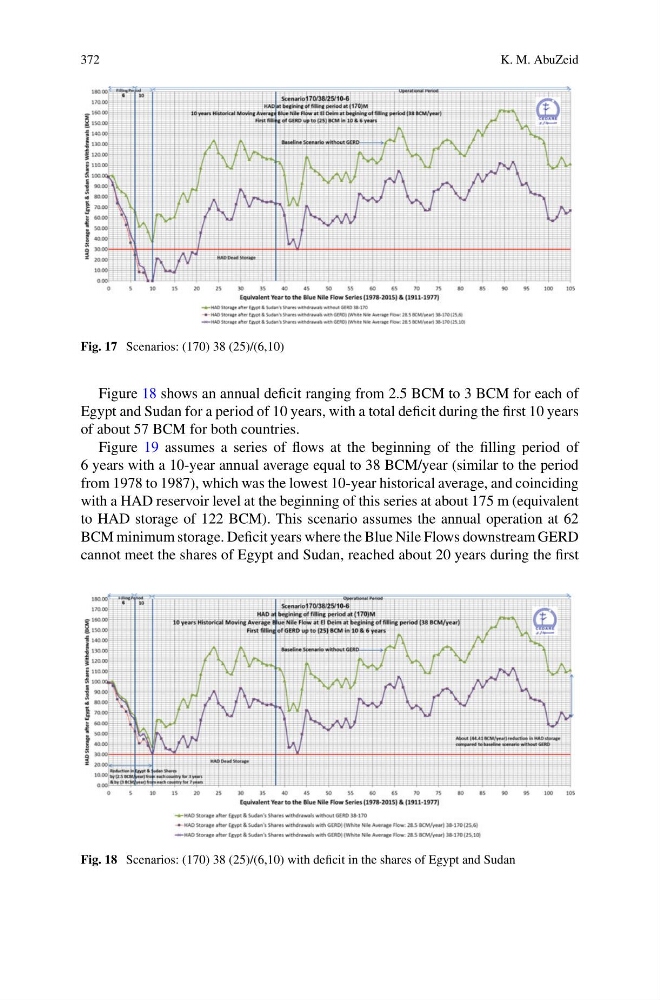
Fig. 17 Scenarios: (170) 38 (25)/(6,10)
Figure 18 shows an annual deficit ranging from 2.5 BCM to 3 BCM for each of
Egypt and Sudan for a period of 10 years, with a total deficit during the first 10 years
of about 57 BCM for both countries.
Figure 19 assumes a series of flows at the beginning of the filling period of
6 years with a 10-year annual average equal to 38 BCM/year (similar to the period
from 1978 to 1987), which was the lowest 10-year historical average, and coinciding
with a HAD reservoir level at the beginning of this series at about 175 m (equivalent
to HAD storage of 122 BCM). This scenario assumes the annual operation at 62
BCM minimum storage. Deficit years where the Blue Nile Flows downstream GERD
cannot meet the shares of Egypt and Sudan, reached about 20 years during the first
Fig. 18 Scenarios: (170) 38 (25)/(6,10) with deficit in the shares of Egypt and Sudan
K. M. AbuZeid
Fig. 17 Scenarios: (170) 38 (25)/(6,10)
Figure 18 shows an annual deficit ranging from 2.5 BCM to 3 BCM for each of
Egypt and Sudan for a period of 10 years, with a total deficit during the first 10 years
of about 57 BCM for both countries.
Figure 19 assumes a series of flows at the beginning of the filling period of
6 years with a 10-year annual average equal to 38 BCM/year (similar to the period
from 1978 to 1987), which was the lowest 10-year historical average, and coinciding
with a HAD reservoir level at the beginning of this series at about 175 m (equivalent
to HAD storage of 122 BCM). This scenario assumes the annual operation at 62
BCM minimum storage. Deficit years where the Blue Nile Flows downstream GERD
cannot meet the shares of Egypt and Sudan, reached about 20 years during the first
Fig. 18 Scenarios: (170) 38 (25)/(6,10) with deficit in the shares of Egypt and Sudan