

366
K. M. AbuZeid
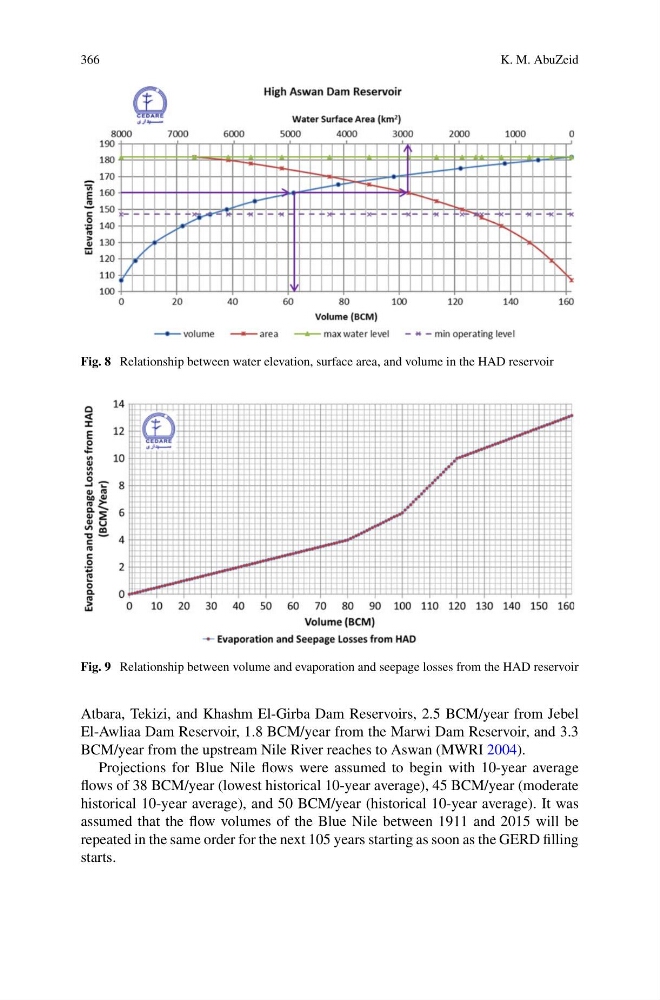
Fig. 8 Relationship between water elevation, surface area, and volume in the HAD reservoir
Fig. 9 Relationship between volume and evaporation and seepage losses from the HAD reservoir
Atbara, Tekizi, and Khashm El-Girba Dam Reservoirs, 2.5 BCM/year from Jebel
El-Awliaa Dam Reservoir, 1.8 BCM/year from the Marwi Dam Reservoir, and 3.3
BCM/year from the upstream Nile River reaches to Aswan (MWRI 2004).
Projections for Blue Nile flows were assumed to begin with 10-year average
flows of 38 BCM/year (lowest historical 10-year average), 45 BCM/year (moderate
historical 10-year average), and 50 BCM/year (historical 10-year average). It was
assumed that the flow volumes of the Blue Nile between 1911 and 2015 will be
repeated in the same order for the next 105 years starting as soon as the GERD filling
starts.
K. M. AbuZeid
Fig. 8 Relationship between water elevation, surface area, and volume in the HAD reservoir
Fig. 9 Relationship between volume and evaporation and seepage losses from the HAD reservoir
Atbara, Tekizi, and Khashm El-Girba Dam Reservoirs, 2.5 BCM/year from Jebel
El-Awliaa Dam Reservoir, 1.8 BCM/year from the Marwi Dam Reservoir, and 3.3
BCM/year from the upstream Nile River reaches to Aswan (MWRI 2004).
Projections for Blue Nile flows were assumed to begin with 10-year average
flows of 38 BCM/year (lowest historical 10-year average), 45 BCM/year (moderate
historical 10-year average), and 50 BCM/year (historical 10-year average). It was
assumed that the flow volumes of the Blue Nile between 1911 and 2015 will be
repeated in the same order for the next 105 years starting as soon as the GERD filling
starts.