

294
I. Thiaw et al.
temperature of the Diarha catchment. This method has been applied in several studies
to correct the extreme signals of climate models (Guo et al. 2018; Mbaye et al. 2018).
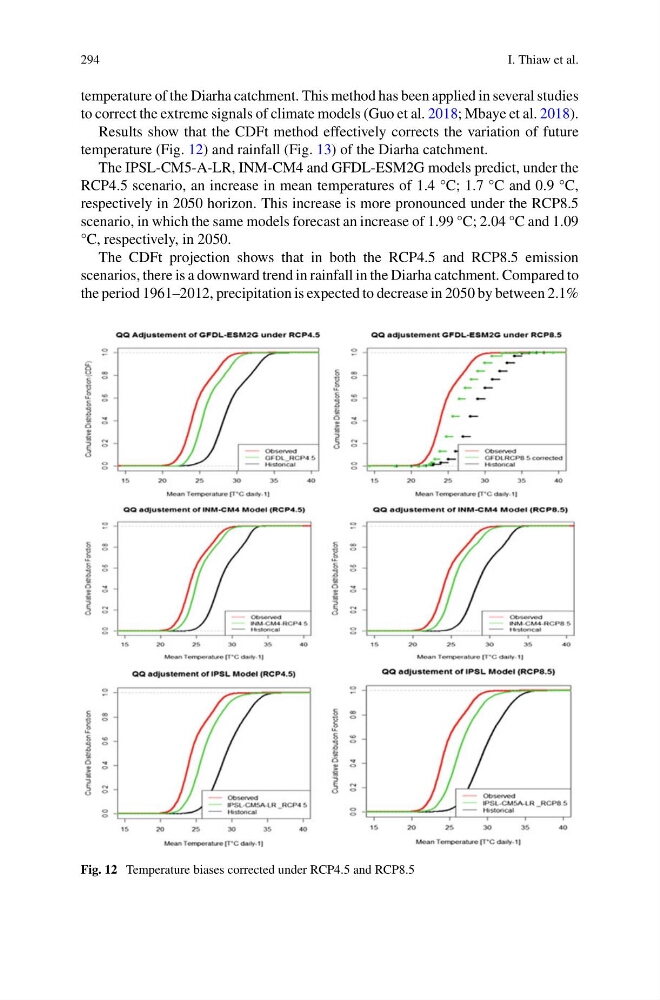
Results show that the CDFt method effectively corrects the variation of future
temperature (Fig. 12) and rainfall (Fig. 13) of the Diarha catchment.
The IPSL-CM5-A-LR, INM-CM4 and GFDL-ESM2G models predict, under the
RCP4.5 scenario, an increase in mean temperatures of 1.4 °C; 1.7 °C and 0.9 °C,
respectively in 2050 horizon. This increase is more pronounced under the RCP8.5
scenario, in which the same models forecast an increase of 1.99 °C; 2.04 °C and 1.09
°C, respectively, in 2050.
The CDFt projection shows that in both the RCP4.5 and RCP8.5 emission
scenarios, there is a downward trend in rainfall in the Diarha catchment. Compared to
the period 1961–2012, precipitation is expected to decrease in 2050 by between 2.1%
Fig. 12 Temperature biases corrected under RCP4.5 and RCP8.5
I. Thiaw et al.
temperature of the Diarha catchment. This method has been applied in several studies
to correct the extreme signals of climate models (Guo et al. 2018; Mbaye et al. 2018).
Results show that the CDFt method effectively corrects the variation of future
temperature (Fig. 12) and rainfall (Fig. 13) of the Diarha catchment.
The IPSL-CM5-A-LR, INM-CM4 and GFDL-ESM2G models predict, under the
RCP4.5 scenario, an increase in mean temperatures of 1.4 °C; 1.7 °C and 0.9 °C,
respectively in 2050 horizon. This increase is more pronounced under the RCP8.5
scenario, in which the same models forecast an increase of 1.99 °C; 2.04 °C and 1.09
°C, respectively, in 2050.
The CDFt projection shows that in both the RCP4.5 and RCP8.5 emission
scenarios, there is a downward trend in rainfall in the Diarha catchment. Compared to
the period 1961–2012, precipitation is expected to decrease in 2050 by between 2.1%
Fig. 12 Temperature biases corrected under RCP4.5 and RCP8.5