

13 Assessment of Hydrological Impacts …
293
Table 6 Segmentation of the
annual flow series of the
Diarha Basin
Beginning
End
Mean discharge (m 3 /s)
1961
1967
9.82
1968
1993
6.01
1994
2012
8.2
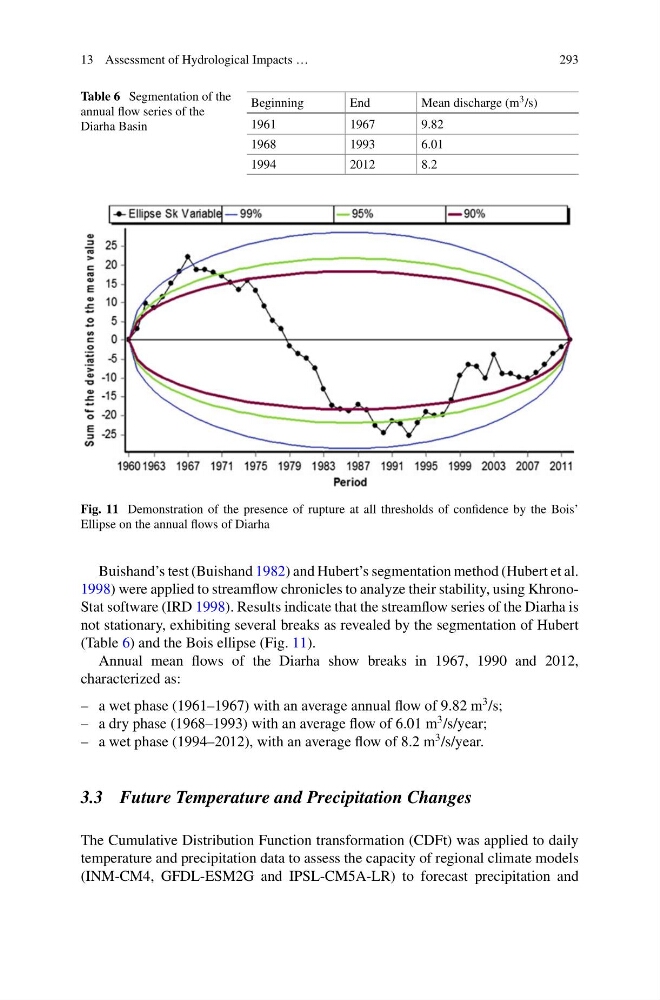
Fig. 11 Demonstration of the presence of rupture at all thresholds of confidence by the Bois’
Ellipse on the annual flows of Diarha
Buishand’s test (Buishand 1982) and Hubert’s segmentation method (Hubert et al.
1998) were applied to streamflow chronicles to analyze their stability, using KhronoStat software (IRD 1998). Results indicate that the streamflow series of the Diarha is
not stationary, exhibiting several breaks as revealed by the segmentation of Hubert
(Table 6) and the Bois ellipse (Fig. 11).
Annual mean flows of the Diarha show breaks in 1967, 1990 and 2012,
characterized as:
– a wet phase (1961–1967) with an average annual flow of 9.82 m
3 /s;
– a dry phase (1968–1993) with an average flow of 6.01 m
3 /s/year;
– a wet phase (1994–2012), with an average flow of 8.2 m
3 /s/year.
3.3 Future Temperature and Precipitation Changes
The Cumulative Distribution Function transformation (CDFt) was applied to daily
temperature and precipitation data to assess the capacity of regional climate models
(INM-CM4, GFDL-ESM2G and IPSL-CM5A-LR) to forecast precipitation and
293
Table 6 Segmentation of the
annual flow series of the
Diarha Basin
Beginning
End
Mean discharge (m 3 /s)
1961
1967
9.82
1968
1993
6.01
1994
2012
8.2
Fig. 11 Demonstration of the presence of rupture at all thresholds of confidence by the Bois’
Ellipse on the annual flows of Diarha
Buishand’s test (Buishand 1982) and Hubert’s segmentation method (Hubert et al.
1998) were applied to streamflow chronicles to analyze their stability, using KhronoStat software (IRD 1998). Results indicate that the streamflow series of the Diarha is
not stationary, exhibiting several breaks as revealed by the segmentation of Hubert
(Table 6) and the Bois ellipse (Fig. 11).
Annual mean flows of the Diarha show breaks in 1967, 1990 and 2012,
characterized as:
– a wet phase (1961–1967) with an average annual flow of 9.82 m
3 /s;
– a dry phase (1968–1993) with an average flow of 6.01 m
3 /s/year;
– a wet phase (1994–2012), with an average flow of 8.2 m
3 /s/year.
3.3 Future Temperature and Precipitation Changes
The Cumulative Distribution Function transformation (CDFt) was applied to daily
temperature and precipitation data to assess the capacity of regional climate models
(INM-CM4, GFDL-ESM2G and IPSL-CM5A-LR) to forecast precipitation and