

292
I. Thiaw et al.
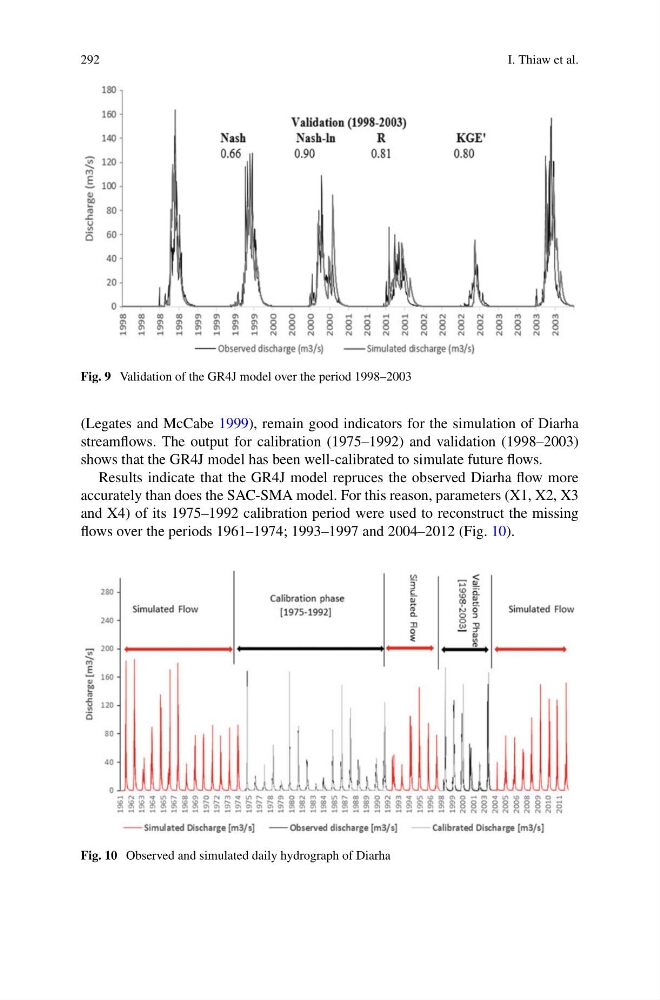
Fig. 9 Validation of the GR4J model over the period 1998–2003
(Legates and McCabe 1999), remain good indicators for the simulation of Diarha
streamflows. The output for calibration (1975–1992) and validation (1998–2003)
shows that the GR4J model has been well-calibrated to simulate future flows.
Results indicate that the GR4J model repruces the observed Diarha flow more
accurately than does the SAC-SMA model. For this reason, parameters (X1, X2, X3
and X4) of its 1975–1992 calibration period were used to reconstruct the missing
flows over the periods 1961–1974; 1993–1997 and 2004–2012 (Fig. 10).
Fig. 10 Observed and simulated daily hydrograph of Diarha
I. Thiaw et al.
Fig. 9 Validation of the GR4J model over the period 1998–2003
(Legates and McCabe 1999), remain good indicators for the simulation of Diarha
streamflows. The output for calibration (1975–1992) and validation (1998–2003)
shows that the GR4J model has been well-calibrated to simulate future flows.
Results indicate that the GR4J model repruces the observed Diarha flow more
accurately than does the SAC-SMA model. For this reason, parameters (X1, X2, X3
and X4) of its 1975–1992 calibration period were used to reconstruct the missing
flows over the periods 1961–1974; 1993–1997 and 2004–2012 (Fig. 10).
Fig. 10 Observed and simulated daily hydrograph of Diarha