

13 Assessment of Hydrological Impacts …
291
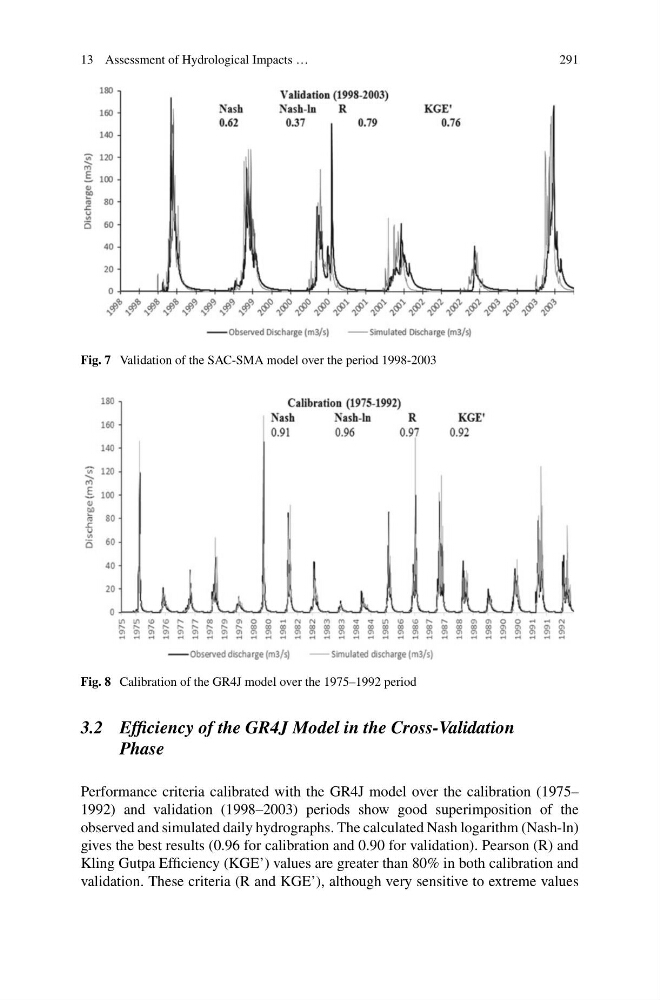
Fig. 7 Validation of the SAC-SMA model over the period 1998-2003
Fig. 8 Calibration of the GR4J model over the 1975–1992 period
3.2 Efficiency of the GR4J Model in the Cross-Validation
Phase
Performance criteria calibrated with the GR4J model over the calibration (1975–
1992) and validation (1998–2003) periods show good superimposition of the
observed and simulated daily hydrographs. The calculated Nash logarithm (Nash-ln)
gives the best results (0.96 for calibration and 0.90 for validation). Pearson (R) and
Kling Gutpa Efficiency (KGE’) values are greater than 80% in both calibration and
validation. These criteria (R and KGE’), although very sensitive to extreme values
291
Fig. 7 Validation of the SAC-SMA model over the period 1998-2003
Fig. 8 Calibration of the GR4J model over the 1975–1992 period
3.2 Efficiency of the GR4J Model in the Cross-Validation
Phase
Performance criteria calibrated with the GR4J model over the calibration (1975–
1992) and validation (1998–2003) periods show good superimposition of the
observed and simulated daily hydrographs. The calculated Nash logarithm (Nash-ln)
gives the best results (0.96 for calibration and 0.90 for validation). Pearson (R) and
Kling Gutpa Efficiency (KGE’) values are greater than 80% in both calibration and
validation. These criteria (R and KGE’), although very sensitive to extreme values