

290
I. Thiaw et al.
F Sf (x) = F Sh
F
− 1
Gh (F Gf (x))
(9)
As with all methods, CDF-t results and technical constraints have their strengths
and weaknesses. An important advantage of CDF-t is that it has been extensively
tested and referenced in various publications since 2009 (Michelangeli et al. 2009;
Vrac et al. 2012, Vrac and Friederichs 2015, 2016; Vigau et al. 2013; Grouillet
et al. 2016; Famien et al. 2018). The Regional Climate Models used in this study
are presented in Table 5. They are bias-corrected at the scale of West Africa within
CORDEX climate projections (Famien et al. 2018).
3 Results
3.1 Efficiency of the SAC-SMA Model
in the Cross-Validation Phase
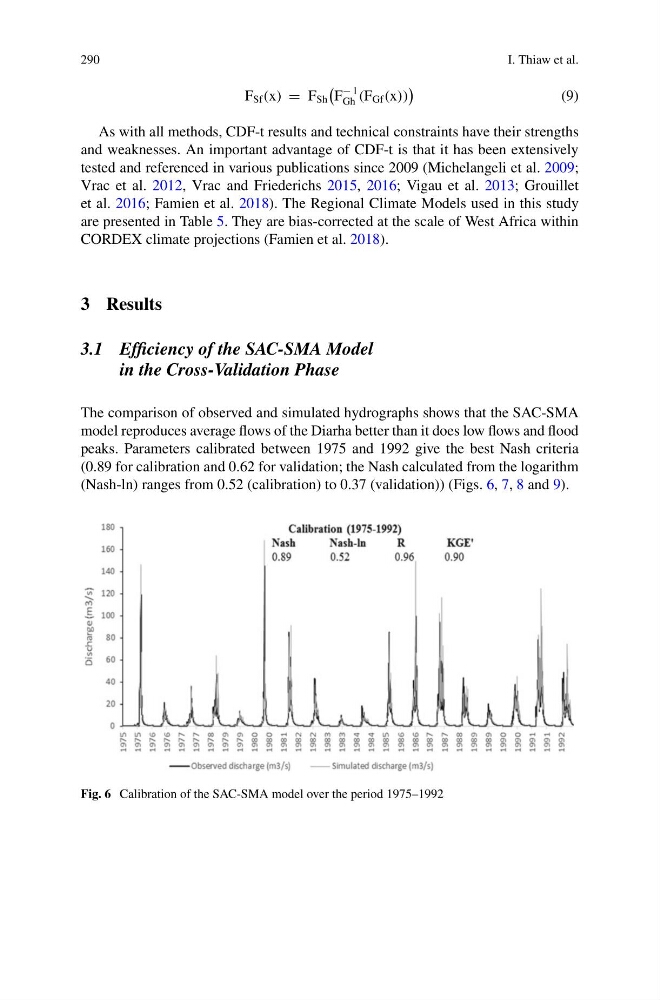
The comparison of observed and simulated hydrographs shows that the SAC-SMA
model reproduces average flows of the Diarha better than it does low flows and flood
peaks. Parameters calibrated between 1975 and 1992 give the best Nash criteria
(0.89 for calibration and 0.62 for validation; the Nash calculated from the logarithm
(Nash-ln) ranges from 0.52 (calibration) to 0.37 (validation)) (Figs. 6, 7, 8 and 9).
Fig. 6 Calibration of the SAC-SMA model over the period 1975–1992
I. Thiaw et al.
F Sf (x) = F Sh
F
− 1
Gh (F Gf (x))
(9)
As with all methods, CDF-t results and technical constraints have their strengths
and weaknesses. An important advantage of CDF-t is that it has been extensively
tested and referenced in various publications since 2009 (Michelangeli et al. 2009;
Vrac et al. 2012, Vrac and Friederichs 2015, 2016; Vigau et al. 2013; Grouillet
et al. 2016; Famien et al. 2018). The Regional Climate Models used in this study
are presented in Table 5. They are bias-corrected at the scale of West Africa within
CORDEX climate projections (Famien et al. 2018).
3 Results
3.1 Efficiency of the SAC-SMA Model
in the Cross-Validation Phase
The comparison of observed and simulated hydrographs shows that the SAC-SMA
model reproduces average flows of the Diarha better than it does low flows and flood
peaks. Parameters calibrated between 1975 and 1992 give the best Nash criteria
(0.89 for calibration and 0.62 for validation; the Nash calculated from the logarithm
(Nash-ln) ranges from 0.52 (calibration) to 0.37 (validation)) (Figs. 6, 7, 8 and 9).
Fig. 6 Calibration of the SAC-SMA model over the period 1975–1992