

13 Assessment of Hydrological Impacts …
283
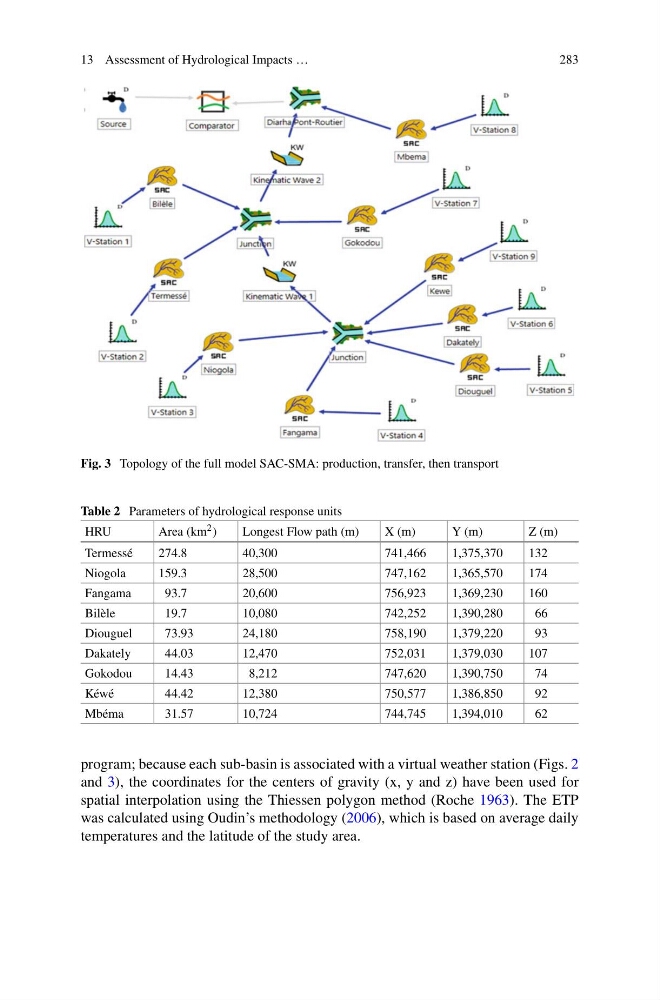
Fig. 3 Topology of the full model SAC-SMA: production, transfer, then transport
Table 2 Parameters of hydrological response units
HRU
Area (km 2 )
Longest Flow path (m)
X (m)
Y (m)
Z (m)
Termessé
274.8
40,300
741,466
1,375,370
132
Niogola
159.3
28,500
747,162
1,365,570
174
Fangama
93.7
20,600
756,923
1,369,230
160
Bilèle
19.7
10,080
742,252
1,390,280
66
Diouguel
73.93
24,180
758,190
1,379,220
93
Dakately
44.03
12,470
752,031
1,379,030
107
Gokodou
14.43
8,212
747,620
1,390,750
74
Kéwé
44.42
12,380
750,577
1,386,850
92
Mbéma
31.57
10,724
744,745
1,394,010
62
program; because each sub-basin is associated with a virtual weather station (Figs. 2
and 3), the coordinates for the centers of gravity (x, y and z) have been used for
spatial interpolation using the Thiessen polygon method (Roche 1963). The ETP
was calculated using Oudin’s methodology (2006), which is based on average daily
temperatures and the latitude of the study area.
283
Fig. 3 Topology of the full model SAC-SMA: production, transfer, then transport
Table 2 Parameters of hydrological response units
HRU
Area (km 2 )
Longest Flow path (m)
X (m)
Y (m)
Z (m)
Termessé
274.8
40,300
741,466
1,375,370
132
Niogola
159.3
28,500
747,162
1,365,570
174
Fangama
93.7
20,600
756,923
1,369,230
160
Bilèle
19.7
10,080
742,252
1,390,280
66
Diouguel
73.93
24,180
758,190
1,379,220
93
Dakately
44.03
12,470
752,031
1,379,030
107
Gokodou
14.43
8,212
747,620
1,390,750
74
Kéwé
44.42
12,380
750,577
1,386,850
92
Mbéma
31.57
10,724
744,745
1,394,010
62
program; because each sub-basin is associated with a virtual weather station (Figs. 2
and 3), the coordinates for the centers of gravity (x, y and z) have been used for
spatial interpolation using the Thiessen polygon method (Roche 1963). The ETP
was calculated using Oudin’s methodology (2006), which is based on average daily
temperatures and the latitude of the study area.