

264
C. Faye et al.
change occurred again in the 1990 s, with river flows rising. We believe that, on an
annual scale, rainfall measured at the stations is quite similar to the date of the break
in 1994. However, the magnitude of the surplus is smaller (23.6%) in Gouloumbou
than at other stations where it exceeds 50% (64.7% in Simenti, 51.5% in Wassadou
and 48.8% in Mako).
Flow changes in the Gambia River Basin are caused by various upheavals,
including climate change. One of its impacts was the severe drought of the 1970s
(Sow 2007; Ozer et al. 2009; Faye et al. 2015b). On the other hand, during the 1990s,
the improvement in rainfall conditions (increase in rainfall) led to an increase in
runoff observed at the various stations.
4.1.3 Climate Change Impacts on Groundwater in the Gambia
Watershed
While accumulated rainfall deficits during the 1970s resulted in diminished underground reserves of river basins (Briquet et al. 1995), the increase in flow in the
Gambia River Basin has increased the volumes drained by groundwater. The natural
low water level in the Sudano-Sahelian rivers are directly affected by changes in
climatic conditions. This depletion is typical of all the aquifers in the basin and is an
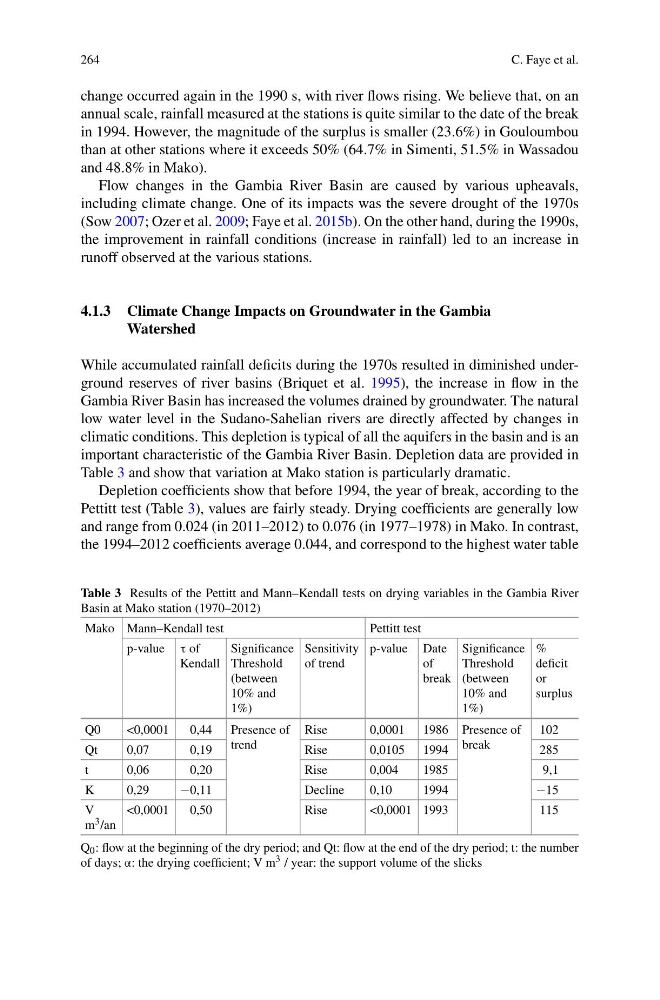
important characteristic of the Gambia River Basin. Depletion data are provided in
Table 3 and show that variation at Mako station is particularly dramatic.
Depletion coefficients show that before 1994, the year of break, according to the
Pettitt test (Table 3), values are fairly steady. Drying coefficients are generally low
and range from 0.024 (in 2011–2012) to 0.076 (in 1977–1978) in Mako. In contrast,
the 1994–2012 coefficients average 0.044, and correspond to the highest water table
Table 3 Results of the Pettitt and Mann–Kendall tests on drying variables in the Gambia River
Basin at Mako station (1970–2012)
Mako Mann–Kendall test
Pettitt test
p-value τ of
Kendall
Significance
Threshold
(between
10% and
1%)
Sensitivity
of trend
p-value Date
of
break
Significance
Threshold
(between
10% and
1%)
%
deficit
or
surplus
Q0
<0,0001
0,44 Presence of
trend
Rise
0,0001 1986 Presence of
break
102
Qt
0,07
0,19
Rise
0,0105 1994
285
t
0,06
0,20
Rise
0,004
1985
9,1
K
0,29
−0,11
Decline
0,10
1994
−15
V
m 3 /an
<0,0001
0,50
Rise
<0,0001 1993
115
Q 0 : flow at the beginning of the dry period; and Qt: flow at the end of the dry period; t: the number
of days; α: the drying coefficient; V m 3 / year: the support volume of the slicks
C. Faye et al.
change occurred again in the 1990 s, with river flows rising. We believe that, on an
annual scale, rainfall measured at the stations is quite similar to the date of the break
in 1994. However, the magnitude of the surplus is smaller (23.6%) in Gouloumbou
than at other stations where it exceeds 50% (64.7% in Simenti, 51.5% in Wassadou
and 48.8% in Mako).
Flow changes in the Gambia River Basin are caused by various upheavals,
including climate change. One of its impacts was the severe drought of the 1970s
(Sow 2007; Ozer et al. 2009; Faye et al. 2015b). On the other hand, during the 1990s,
the improvement in rainfall conditions (increase in rainfall) led to an increase in
runoff observed at the various stations.
4.1.3 Climate Change Impacts on Groundwater in the Gambia
Watershed
While accumulated rainfall deficits during the 1970s resulted in diminished underground reserves of river basins (Briquet et al. 1995), the increase in flow in the
Gambia River Basin has increased the volumes drained by groundwater. The natural
low water level in the Sudano-Sahelian rivers are directly affected by changes in
climatic conditions. This depletion is typical of all the aquifers in the basin and is an
important characteristic of the Gambia River Basin. Depletion data are provided in
Table 3 and show that variation at Mako station is particularly dramatic.
Depletion coefficients show that before 1994, the year of break, according to the
Pettitt test (Table 3), values are fairly steady. Drying coefficients are generally low
and range from 0.024 (in 2011–2012) to 0.076 (in 1977–1978) in Mako. In contrast,
the 1994–2012 coefficients average 0.044, and correspond to the highest water table
Table 3 Results of the Pettitt and Mann–Kendall tests on drying variables in the Gambia River
Basin at Mako station (1970–2012)
Mako Mann–Kendall test
Pettitt test
p-value τ of
Kendall
Significance
Threshold
(between
10% and
1%)
Sensitivity
of trend
p-value Date
of
break
Significance
Threshold
(between
10% and
1%)
%
deficit
or
surplus
Q0
<0,0001
0,44 Presence of
trend
Rise
0,0001 1986 Presence of
break
102
Qt
0,07
0,19
Rise
0,0105 1994
285
t
0,06
0,20
Rise
0,004
1985
9,1
K
0,29
−0,11
Decline
0,10
1994
−15
V
m 3 /an
<0,0001
0,50
Rise
<0,0001 1993
115
Q 0 : flow at the beginning of the dry period; and Qt: flow at the end of the dry period; t: the number
of days; α: the drying coefficient; V m 3 / year: the support volume of the slicks