

12 Water Management Policy for Freshwater Security …
263
drought of the 1970s as confirmed by multiple studies (Sow 2007; Faye 2013; Faye
et al. 2015b), another important change in rainfall pattern is observed at the turn
of the twenty-first century as indicated by studies (Ali and Lebel 2009; Ozer et al.
2009; Ouoba 2013; Bodian 2014) that suggest the end of Sahelian drought during
the 1990s. Thus, in the year before and year after the break, rainfall increased by
13.3% in Tambacounda and 21% in Kédougou.
4.1.2 Impacts of Climate Change on Surface Waters in the Gambia
Basin
The impact of climate change on surface waters in the Gambia River Basin have
been analyzed using standardized flow indices. Deriving these indices from different
stations allows better comparison of station data as basins of different sizes drain.
The indices subjected to Mann–Kendall and Pettitt tests reveal significant fluctuations
with multiple consequences for the environment, making them worthy of study. The
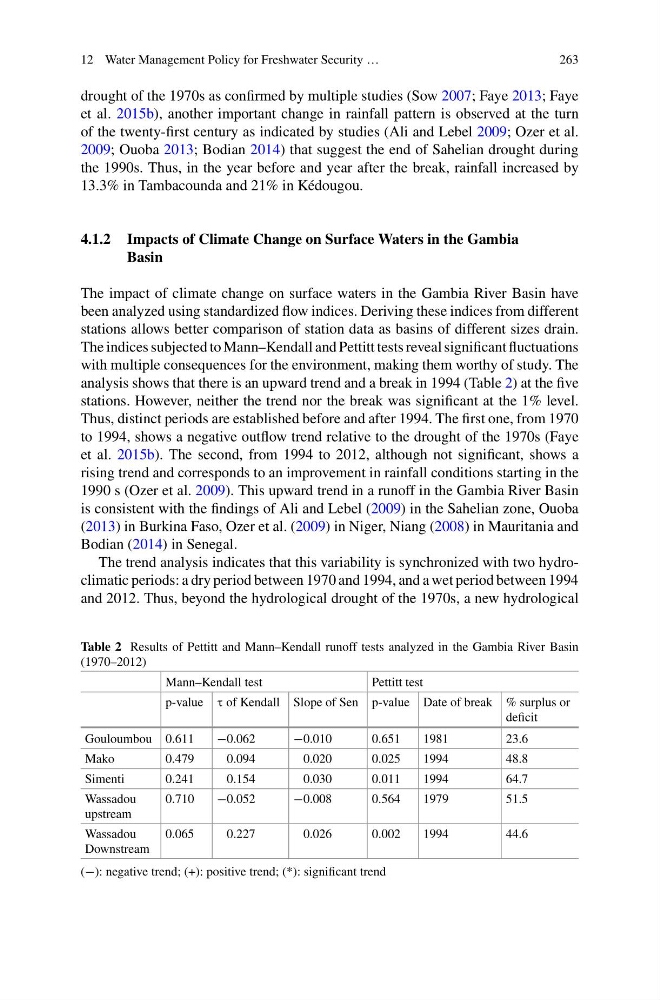
analysis shows that there is an upward trend and a break in 1994 (Table 2) at the five
stations. However, neither the trend nor the break was significant at the 1% level.
Thus, distinct periods are established before and after 1994. The first one, from 1970
to 1994, shows a negative outflow trend relative to the drought of the 1970s (Faye
et al. 2015b). The second, from 1994 to 2012, although not significant, shows a
rising trend and corresponds to an improvement in rainfall conditions starting in the
1990 s (Ozer et al. 2009). This upward trend in a runoff in the Gambia River Basin
is consistent with the findings of Ali and Lebel (2009) in the Sahelian zone, Ouoba
(2013) in Burkina Faso, Ozer et al. (2009) in Niger, Niang (2008) in Mauritania and
Bodian (2014) in Senegal.
The trend analysis indicates that this variability is synchronized with two hydroclimatic periods: a dry period between 1970 and 1994, and a wet period between 1994
and 2012. Thus, beyond the hydrological drought of the 1970s, a new hydrological
Table 2 Results of Pettitt and Mann–Kendall runoff tests analyzed in the Gambia River Basin
(1970–2012)
Mann–Kendall test
Pettitt test
p-value τ of Kendall Slope of Sen p-value Date of break % surplus or
deficit
Gouloumbou 0.611
−0.062
−0.010
0.651
1981
23.6
Mako
0.479
0.094
0.020
0.025
1994
48.8
Simenti
0.241
0.154
0.030
0.011
1994
64.7
Wassadou
upstream
0.710
−0.052
−0.008
0.564
1979
51.5
Wassadou
Downstream
0.065
0.227
0.026
0.002
1994
44.6
(−): negative trend; (+): positive trend; (*): significant trend
263
drought of the 1970s as confirmed by multiple studies (Sow 2007; Faye 2013; Faye
et al. 2015b), another important change in rainfall pattern is observed at the turn
of the twenty-first century as indicated by studies (Ali and Lebel 2009; Ozer et al.
2009; Ouoba 2013; Bodian 2014) that suggest the end of Sahelian drought during
the 1990s. Thus, in the year before and year after the break, rainfall increased by
13.3% in Tambacounda and 21% in Kédougou.
4.1.2 Impacts of Climate Change on Surface Waters in the Gambia
Basin
The impact of climate change on surface waters in the Gambia River Basin have
been analyzed using standardized flow indices. Deriving these indices from different
stations allows better comparison of station data as basins of different sizes drain.
The indices subjected to Mann–Kendall and Pettitt tests reveal significant fluctuations
with multiple consequences for the environment, making them worthy of study. The
analysis shows that there is an upward trend and a break in 1994 (Table 2) at the five
stations. However, neither the trend nor the break was significant at the 1% level.
Thus, distinct periods are established before and after 1994. The first one, from 1970
to 1994, shows a negative outflow trend relative to the drought of the 1970s (Faye
et al. 2015b). The second, from 1994 to 2012, although not significant, shows a
rising trend and corresponds to an improvement in rainfall conditions starting in the
1990 s (Ozer et al. 2009). This upward trend in a runoff in the Gambia River Basin
is consistent with the findings of Ali and Lebel (2009) in the Sahelian zone, Ouoba
(2013) in Burkina Faso, Ozer et al. (2009) in Niger, Niang (2008) in Mauritania and
Bodian (2014) in Senegal.
The trend analysis indicates that this variability is synchronized with two hydroclimatic periods: a dry period between 1970 and 1994, and a wet period between 1994
and 2012. Thus, beyond the hydrological drought of the 1970s, a new hydrological
Table 2 Results of Pettitt and Mann–Kendall runoff tests analyzed in the Gambia River Basin
(1970–2012)
Mann–Kendall test
Pettitt test
p-value τ of Kendall Slope of Sen p-value Date of break % surplus or
deficit
Gouloumbou 0.611
−0.062
−0.010
0.651
1981
23.6
Mako
0.479
0.094
0.020
0.025
1994
48.8
Simenti
0.241
0.154
0.030
0.011
1994
64.7
Wassadou
upstream
0.710
−0.052
−0.008
0.564
1979
51.5
Wassadou
Downstream
0.065
0.227
0.026
0.002
1994
44.6
(−): negative trend; (+): positive trend; (*): significant trend