

262
C. Faye et al.
4 Results and Discussion
4.1 Characterization of Climate Change Impacts: The
Gambia Watershed
4.1.1 Temperature and Precipitation Trend
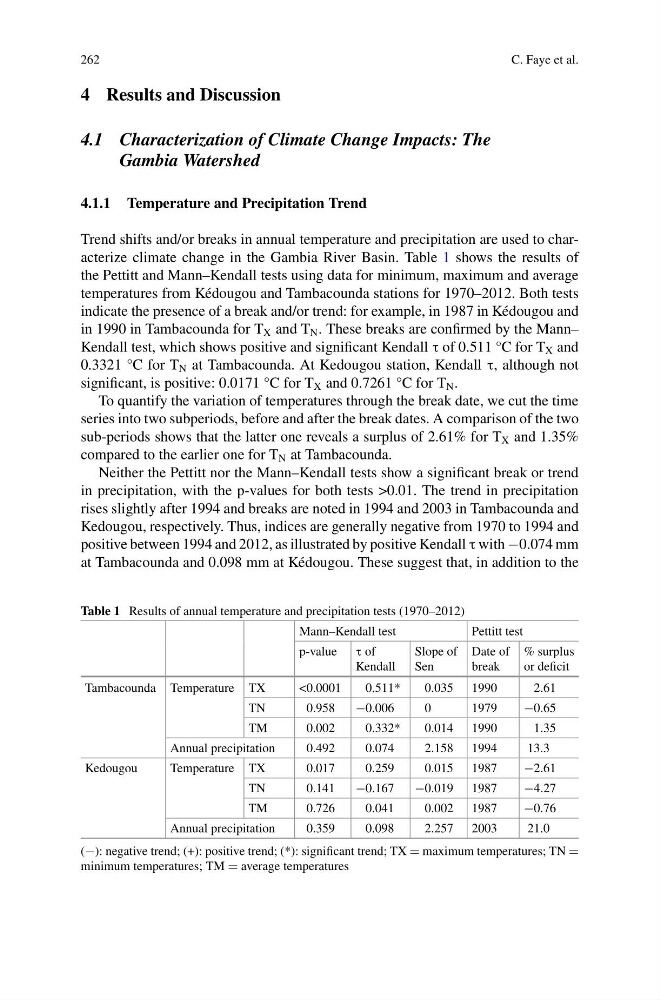
Trend shifts and/or breaks in annual temperature and precipitation are used to characterize climate change in the Gambia River Basin. Table 1 shows the results of
the Pettitt and Mann–Kendall tests using data for minimum, maximum and average
temperatures from Kédougou and Tambacounda stations for 1970–2012. Both tests
indicate the presence of a break and/or trend: for example, in 1987 in Kédougou and
in 1990 in Tambacounda for T X and T N . These breaks are confirmed by the Mann–
Kendall test, which shows positive and significant Kendall τ of 0.511 °C for T X and
0.3321 °C for T N at Tambacounda. At Kedougou station, Kendall τ, although not
significant, is positive: 0.0171 °C for T X and 0.7261 °C for T N .
To quantify the variation of temperatures through the break date, we cut the time
series into two subperiods, before and after the break dates. A comparison of the two
sub-periods shows that the latter one reveals a surplus of 2.61% for T X and 1.35%
compared to the earlier one for T N at Tambacounda.
Neither the Pettitt nor the Mann–Kendall tests show a significant break or trend
in precipitation, with the p-values for both tests >0.01. The trend in precipitation
rises slightly after 1994 and breaks are noted in 1994 and 2003 in Tambacounda and
Kedougou, respectively. Thus, indices are generally negative from 1970 to 1994 and
positive between 1994 and 2012, as illustrated by positive Kendall τ with −0.074 mm
at Tambacounda and 0.098 mm at Kédougou. These suggest that, in addition to the
Table 1 Results of annual temperature and precipitation tests (1970–2012)
Mann–Kendall test
Pettitt test
p-value τ of
Kendall
Slope of
Sen
Date of
break
% surplus
or deficit
Tambacounda Temperature TX
<0.0001
0.511*
0.035 1990
2.61
TN
0.958
−0.006
0
1979
−0.65
TM
0.002
0.332*
0.014 1990
1.35
Annual precipitation
0.492
0.074
2.158 1994
13.3
Kedougou
Temperature TX
0.017
0.259
0.015 1987
−2.61
TN
0.141
−0.167
−0.019 1987
−4.27
TM
0.726
0.041
0.002 1987
−0.76
Annual precipitation
0.359
0.098
2.257 2003
21.0
(−): negative trend; (+): positive trend; (*): significant trend; TX = maximum temperatures; TN =
minimum temperatures; TM = average temperatures
C. Faye et al.
4 Results and Discussion
4.1 Characterization of Climate Change Impacts: The
Gambia Watershed
4.1.1 Temperature and Precipitation Trend
Trend shifts and/or breaks in annual temperature and precipitation are used to characterize climate change in the Gambia River Basin. Table 1 shows the results of
the Pettitt and Mann–Kendall tests using data for minimum, maximum and average
temperatures from Kédougou and Tambacounda stations for 1970–2012. Both tests
indicate the presence of a break and/or trend: for example, in 1987 in Kédougou and
in 1990 in Tambacounda for T X and T N . These breaks are confirmed by the Mann–
Kendall test, which shows positive and significant Kendall τ of 0.511 °C for T X and
0.3321 °C for T N at Tambacounda. At Kedougou station, Kendall τ, although not
significant, is positive: 0.0171 °C for T X and 0.7261 °C for T N .
To quantify the variation of temperatures through the break date, we cut the time
series into two subperiods, before and after the break dates. A comparison of the two
sub-periods shows that the latter one reveals a surplus of 2.61% for T X and 1.35%
compared to the earlier one for T N at Tambacounda.
Neither the Pettitt nor the Mann–Kendall tests show a significant break or trend
in precipitation, with the p-values for both tests >0.01. The trend in precipitation
rises slightly after 1994 and breaks are noted in 1994 and 2003 in Tambacounda and
Kedougou, respectively. Thus, indices are generally negative from 1970 to 1994 and
positive between 1994 and 2012, as illustrated by positive Kendall τ with −0.074 mm
at Tambacounda and 0.098 mm at Kédougou. These suggest that, in addition to the
Table 1 Results of annual temperature and precipitation tests (1970–2012)
Mann–Kendall test
Pettitt test
p-value τ of
Kendall
Slope of
Sen
Date of
break
% surplus
or deficit
Tambacounda Temperature TX
<0.0001
0.511*
0.035 1990
2.61
TN
0.958
−0.006
0
1979
−0.65
TM
0.002
0.332*
0.014 1990
1.35
Annual precipitation
0.492
0.074
2.158 1994
13.3
Kedougou
Temperature TX
0.017
0.259
0.015 1987
−2.61
TN
0.141
−0.167
−0.019 1987
−4.27
TM
0.726
0.041
0.002 1987
−0.76
Annual precipitation
0.359
0.098
2.257 2003
21.0
(−): negative trend; (+): positive trend; (*): significant trend; TX = maximum temperatures; TN =
minimum temperatures; TM = average temperatures