

6 Multi-objective Performance Optimization of a Ribbed Solar …
85
S
N
= −10 log
Y /S
2
Y
n
(6.12)
Larger is better:
S
N
= −10 log
1/y
2
n
(6.13)
where, y and Y is the local and averaged observed data of n number of observations,
respectively, while S
2
Y is variance of y. Suitably “larger is better” characteristic is
used for maximization of heat transfer (Nu) and performance (η), while “smaller is
better” characteristic is employed for minimization of pumping power (f ).
6.4 Results and Discussion
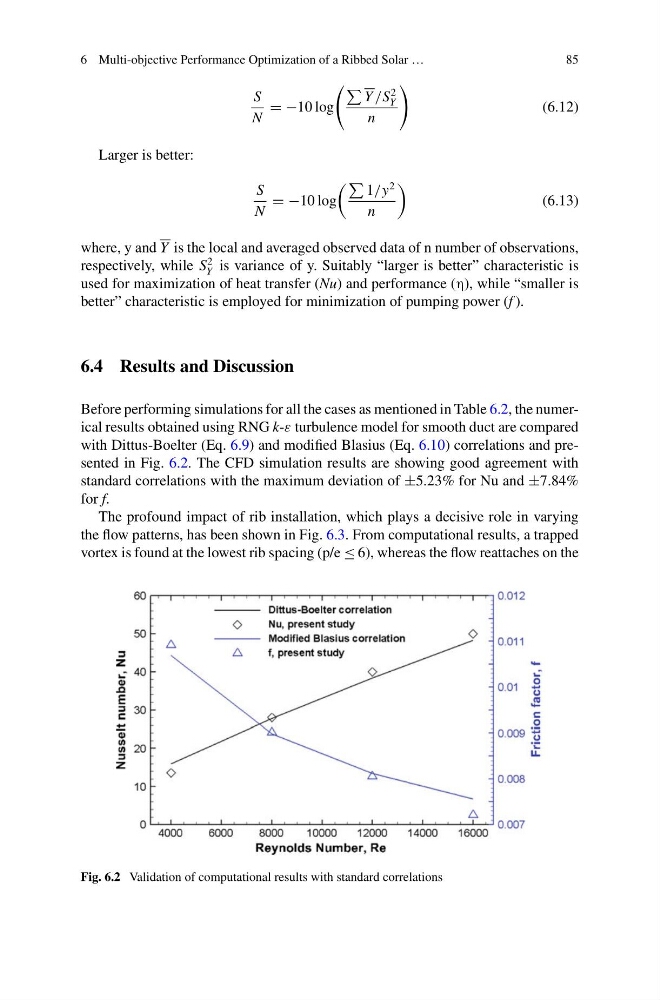
Before performing simulations for all the cases as mentioned in Table 6.2, the numerical results obtained using RNG k-ε turbulence model for smooth duct are compared
with Dittus-Boelter (Eq. 6.9) and modified Blasius (Eq. 6.10) correlations and presented in Fig. 6.2. The CFD simulation results are showing good agreement with
standard correlations with the maximum deviation of ±5.23% for Nu and ±7.84%
for f.
The profound impact of rib installation, which plays a decisive role in varying
the flow patterns, has been shown in Fig. 6.3. From computational results, a trapped
vortex is found at the lowest rib spacing (p/e ≤ 6), whereas the flow reattaches on the
Fig. 6.2 Validation of computational results with standard correlations
85
S
N
= −10 log
Y /S
2
Y
n
(6.12)
Larger is better:
S
N
= −10 log
1/y
2
n
(6.13)
where, y and Y is the local and averaged observed data of n number of observations,
respectively, while S
2
Y is variance of y. Suitably “larger is better” characteristic is
used for maximization of heat transfer (Nu) and performance (η), while “smaller is
better” characteristic is employed for minimization of pumping power (f ).
6.4 Results and Discussion
Before performing simulations for all the cases as mentioned in Table 6.2, the numerical results obtained using RNG k-ε turbulence model for smooth duct are compared
with Dittus-Boelter (Eq. 6.9) and modified Blasius (Eq. 6.10) correlations and presented in Fig. 6.2. The CFD simulation results are showing good agreement with
standard correlations with the maximum deviation of ±5.23% for Nu and ±7.84%
for f.
The profound impact of rib installation, which plays a decisive role in varying
the flow patterns, has been shown in Fig. 6.3. From computational results, a trapped
vortex is found at the lowest rib spacing (p/e ≤ 6), whereas the flow reattaches on the
Fig. 6.2 Validation of computational results with standard correlations