

84
N. Sharma and R. Choudhary
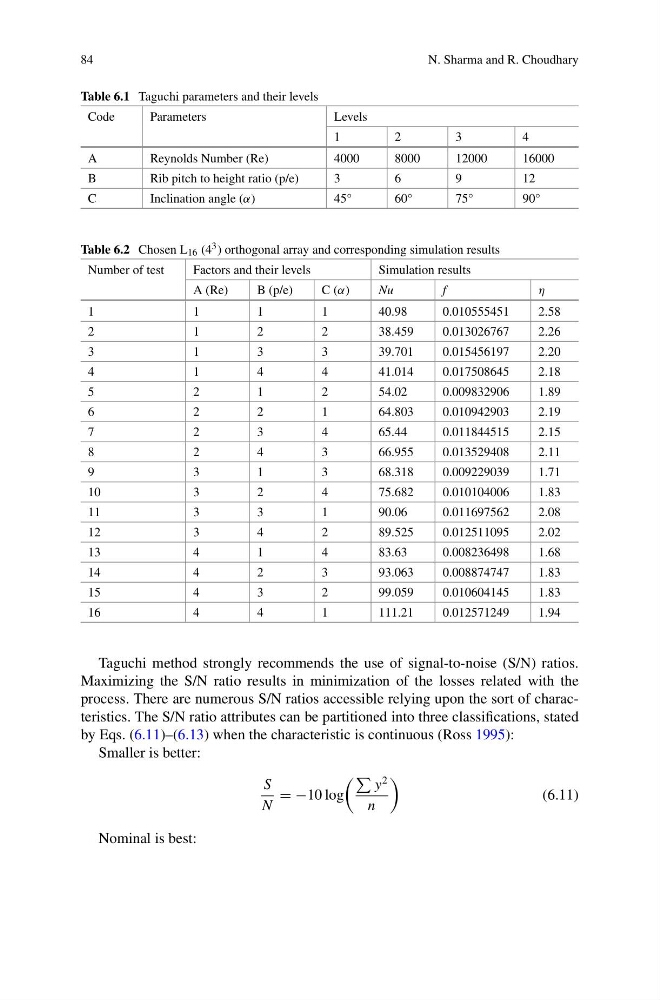
Table 6.1 Taguchi parameters and their levels
Code
Parameters
Levels
1
2
3
4
A
Reynolds Number (Re)
4000
8000
12000
16000
B
Rib pitch to height ratio (p/e)
3
6
9
12
C
Inclination angle (α)
45°
60°
75°
90°
Table 6.2 Chosen L 16 (4 3 ) orthogonal array and corresponding simulation results
Number of test
Factors and their levels
Simulation results
A (Re)
B (p/e)
C (α)
Nu
f
η
1
1
1
1
40.98
0.010555451
2.58
2
1
2
2
38.459
0.013026767
2.26
3
1
3
3
39.701
0.015456197
2.20
4
1
4
4
41.014
0.017508645
2.18
5
2
1
2
54.02
0.009832906
1.89
6
2
2
1
64.803
0.010942903
2.19
7
2
3
4
65.44
0.011844515
2.15
8
2
4
3
66.955
0.013529408
2.11
9
3
1
3
68.318
0.009229039
1.71
10
3
2
4
75.682
0.010104006
1.83
11
3
3
1
90.06
0.011697562
2.08
12
3
4
2
89.525
0.012511095
2.02
13
4
1
4
83.63
0.008236498
1.68
14
4
2
3
93.063
0.008874747
1.83
15
4
3
2
99.059
0.010604145
1.83
16
4
4
1
111.21
0.012571249
1.94
Taguchi method strongly recommends the use of signal-to-noise (S/N) ratios.
Maximizing the S/N ratio results in minimization of the losses related with the
process. There are numerous S/N ratios accessible relying upon the sort of characteristics. The S/N ratio attributes can be partitioned into three classifications, stated
by Eqs. (6.11)–(6.13) when the characteristic is continuous (Ross 1995):
Smaller is better:
S
N
= −10 log
y
2
n
(6.11)
Nominal is best:
N. Sharma and R. Choudhary
Table 6.1 Taguchi parameters and their levels
Code
Parameters
Levels
1
2
3
4
A
Reynolds Number (Re)
4000
8000
12000
16000
B
Rib pitch to height ratio (p/e)
3
6
9
12
C
Inclination angle (α)
45°
60°
75°
90°
Table 6.2 Chosen L 16 (4 3 ) orthogonal array and corresponding simulation results
Number of test
Factors and their levels
Simulation results
A (Re)
B (p/e)
C (α)
Nu
f
η
1
1
1
1
40.98
0.010555451
2.58
2
1
2
2
38.459
0.013026767
2.26
3
1
3
3
39.701
0.015456197
2.20
4
1
4
4
41.014
0.017508645
2.18
5
2
1
2
54.02
0.009832906
1.89
6
2
2
1
64.803
0.010942903
2.19
7
2
3
4
65.44
0.011844515
2.15
8
2
4
3
66.955
0.013529408
2.11
9
3
1
3
68.318
0.009229039
1.71
10
3
2
4
75.682
0.010104006
1.83
11
3
3
1
90.06
0.011697562
2.08
12
3
4
2
89.525
0.012511095
2.02
13
4
1
4
83.63
0.008236498
1.68
14
4
2
3
93.063
0.008874747
1.83
15
4
3
2
99.059
0.010604145
1.83
16
4
4
1
111.21
0.012571249
1.94
Taguchi method strongly recommends the use of signal-to-noise (S/N) ratios.
Maximizing the S/N ratio results in minimization of the losses related with the
process. There are numerous S/N ratios accessible relying upon the sort of characteristics. The S/N ratio attributes can be partitioned into three classifications, stated
by Eqs. (6.11)–(6.13) when the characteristic is continuous (Ross 1995):
Smaller is better:
S
N
= −10 log
y
2
n
(6.11)
Nominal is best: