

6 Multi-objective Performance Optimization of a Ribbed Solar …
83
f =
2 × P × D h
ρu 2 L
(6.7)
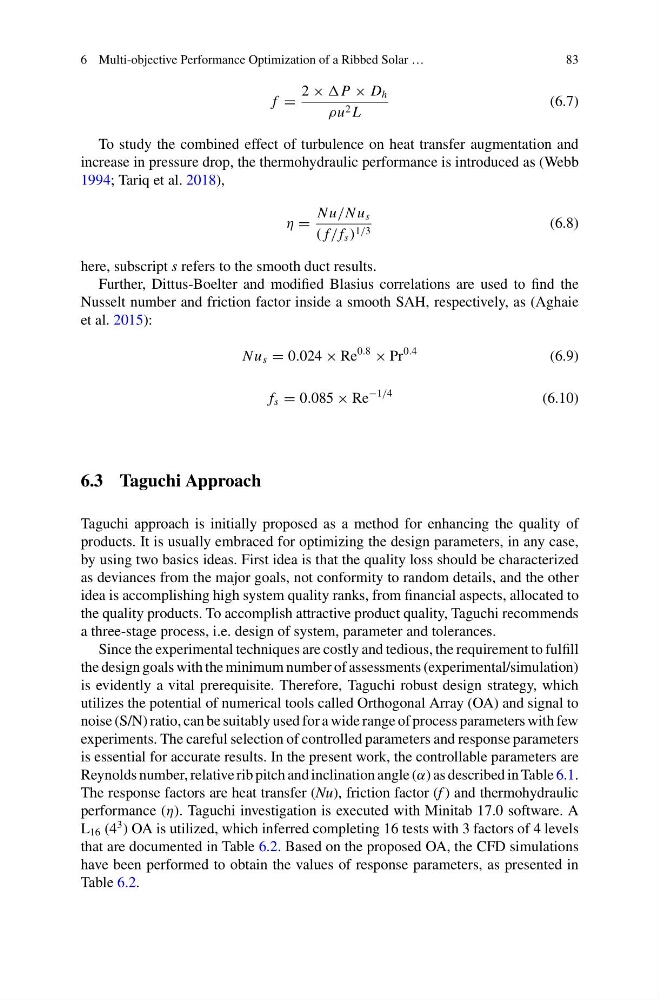
To study the combined effect of turbulence on heat transfer augmentation and
increase in pressure drop, the thermohydraulic performance is introduced as (Webb
1994; Tariq et al. 2018),
η =
N u/N u s
( f / f s ) 1/3
(6.8)
here, subscript s refers to the smooth duct results.
Further, Dittus-Boelter and modified Blasius correlations are used to find the
Nusselt number and friction factor inside a smooth SAH, respectively, as (Aghaie
et al. 2015):
N u s = 0.024 × Re
0.8
× Pr
0.4
(6.9)
f s = 0.085 × Re
−1/4
(6.10)
6.3 Taguchi Approach
Taguchi approach is initially proposed as a method for enhancing the quality of
products. It is usually embraced for optimizing the design parameters, in any case,
by using two basics ideas. First idea is that the quality loss should be characterized
as deviances from the major goals, not conformity to random details, and the other
idea is accomplishing high system quality ranks, from financial aspects, allocated to
the quality products. To accomplish attractive product quality, Taguchi recommends
a three-stage process, i.e. design of system, parameter and tolerances.
Since the experimental techniques are costly and tedious, the requirement to fulfill
the design goals with the minimum number of assessments (experimental/simulation)
is evidently a vital prerequisite. Therefore, Taguchi robust design strategy, which
utilizes the potential of numerical tools called Orthogonal Array (OA) and signal to
noise (S/N) ratio, can be suitably used for a wide range of process parameters with few
experiments. The careful selection of controlled parameters and response parameters
is essential for accurate results. In the present work, the controllable parameters are
Reynolds number, relative rib pitch and inclination angle (α) as described in Table 6.1.
The response factors are heat transfer (Nu), friction factor (f ) and thermohydraulic
performance (η). Taguchi investigation is executed with Minitab 17.0 software. A
L 16 (4
3 ) OA is utilized, which inferred completing 16 tests with 3 factors of 4 levels
that are documented in Table 6.2. Based on the proposed OA, the CFD simulations
have been performed to obtain the values of response parameters, as presented in
Table 6.2.
83
f =
2 × P × D h
ρu 2 L
(6.7)
To study the combined effect of turbulence on heat transfer augmentation and
increase in pressure drop, the thermohydraulic performance is introduced as (Webb
1994; Tariq et al. 2018),
η =
N u/N u s
( f / f s ) 1/3
(6.8)
here, subscript s refers to the smooth duct results.
Further, Dittus-Boelter and modified Blasius correlations are used to find the
Nusselt number and friction factor inside a smooth SAH, respectively, as (Aghaie
et al. 2015):
N u s = 0.024 × Re
0.8
× Pr
0.4
(6.9)
f s = 0.085 × Re
−1/4
(6.10)
6.3 Taguchi Approach
Taguchi approach is initially proposed as a method for enhancing the quality of
products. It is usually embraced for optimizing the design parameters, in any case,
by using two basics ideas. First idea is that the quality loss should be characterized
as deviances from the major goals, not conformity to random details, and the other
idea is accomplishing high system quality ranks, from financial aspects, allocated to
the quality products. To accomplish attractive product quality, Taguchi recommends
a three-stage process, i.e. design of system, parameter and tolerances.
Since the experimental techniques are costly and tedious, the requirement to fulfill
the design goals with the minimum number of assessments (experimental/simulation)
is evidently a vital prerequisite. Therefore, Taguchi robust design strategy, which
utilizes the potential of numerical tools called Orthogonal Array (OA) and signal to
noise (S/N) ratio, can be suitably used for a wide range of process parameters with few
experiments. The careful selection of controlled parameters and response parameters
is essential for accurate results. In the present work, the controllable parameters are
Reynolds number, relative rib pitch and inclination angle (α) as described in Table 6.1.
The response factors are heat transfer (Nu), friction factor (f ) and thermohydraulic
performance (η). Taguchi investigation is executed with Minitab 17.0 software. A
L 16 (4
3 ) OA is utilized, which inferred completing 16 tests with 3 factors of 4 levels
that are documented in Table 6.2. Based on the proposed OA, the CFD simulations
have been performed to obtain the values of response parameters, as presented in
Table 6.2.