

4 Utilising Passive Design Strategies for Analysing Thermal …
43
Table 4.2 Building element details
Building
element
Layer
Thickness
(m)
Thermal
conductivity
(W/m K)
Specific heat
capacity
(kJ/kg K)
Density
(kg/m 3 )
External
walls
Gypsum
plaster
0.012
0.22
1.09
970
Bricks
0.230
0.58
0.84
1500
Gypsum
plaster
0.012
0.22
1.09
970
Roof
Gypsum
plaster
0.012
0.22
1.09
970
Concrete
slab
0.127
1.70
0.88
2300
Cement
mortar slurry
0.100
0.72
0.92
1648
Mud phuska
0.102
0.52
0.88
1622
Brick tiles
0.038
0.79
0.88
1892
Floor
Concrete
slab
0.13
1.7
0.88
2300
Gypsum
plaster
0.012
0.22
1.09
970
Marble tiles
0.039
3.00
0.88
2300
Doors
Wood
0.039
0.14
0.50
2300
Table 4.3 Window properties of the building
Properties Thickness
(m)
Solar heat
gain
coefficient
(SHGC)
Transmittance
U-value
(W/m 2 K)
Emissivity
Solar Visible
Internal External
Values
0.012
0.68
0.60
0.74
1.90
0.84
0.84
In addition to the experimental work, a simulation study analysis has been performed to investigate the impact of different passive parameters on the occupant’s
thermal comfort, for which, IDA ICE 4.7 Beta software has been used. The design
input parameters of the study include the time zone of the location—+5.5 h and the
latitude and longitude of the place, being N 28° 36
E 77° 12
respectively. The office
room has been modeled as a single zone in the software and the construction and
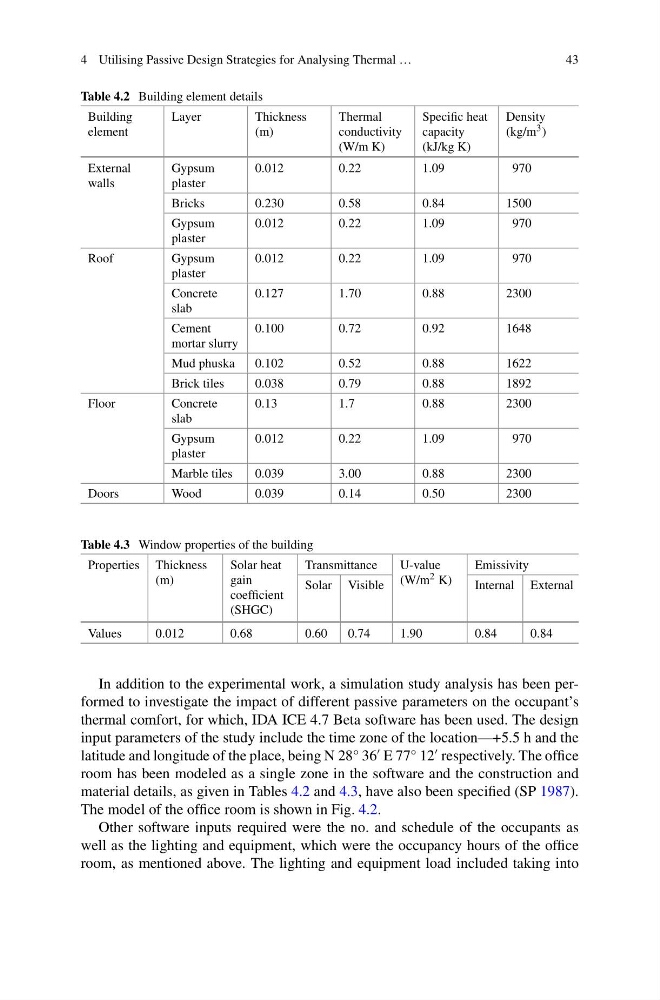
material details, as given in Tables 4.2 and 4.3, have also been specified (SP 1987).
The model of the office room is shown in Fig. 4.2.
Other software inputs required were the no. and schedule of the occupants as
well as the lighting and equipment, which were the occupancy hours of the office
room, as mentioned above. The lighting and equipment load included taking into
43
Table 4.2 Building element details
Building
element
Layer
Thickness
(m)
Thermal
conductivity
(W/m K)
Specific heat
capacity
(kJ/kg K)
Density
(kg/m 3 )
External
walls
Gypsum
plaster
0.012
0.22
1.09
970
Bricks
0.230
0.58
0.84
1500
Gypsum
plaster
0.012
0.22
1.09
970
Roof
Gypsum
plaster
0.012
0.22
1.09
970
Concrete
slab
0.127
1.70
0.88
2300
Cement
mortar slurry
0.100
0.72
0.92
1648
Mud phuska
0.102
0.52
0.88
1622
Brick tiles
0.038
0.79
0.88
1892
Floor
Concrete
slab
0.13
1.7
0.88
2300
Gypsum
plaster
0.012
0.22
1.09
970
Marble tiles
0.039
3.00
0.88
2300
Doors
Wood
0.039
0.14
0.50
2300
Table 4.3 Window properties of the building
Properties Thickness
(m)
Solar heat
gain
coefficient
(SHGC)
Transmittance
U-value
(W/m 2 K)
Emissivity
Solar Visible
Internal External
Values
0.012
0.68
0.60
0.74
1.90
0.84
0.84
In addition to the experimental work, a simulation study analysis has been performed to investigate the impact of different passive parameters on the occupant’s
thermal comfort, for which, IDA ICE 4.7 Beta software has been used. The design
input parameters of the study include the time zone of the location—+5.5 h and the
latitude and longitude of the place, being N 28° 36
E 77° 12
respectively. The office
room has been modeled as a single zone in the software and the construction and
material details, as given in Tables 4.2 and 4.3, have also been specified (SP 1987).
The model of the office room is shown in Fig. 4.2.
Other software inputs required were the no. and schedule of the occupants as
well as the lighting and equipment, which were the occupancy hours of the office
room, as mentioned above. The lighting and equipment load included taking into