

44
S. F. Ali and D. Rakshit
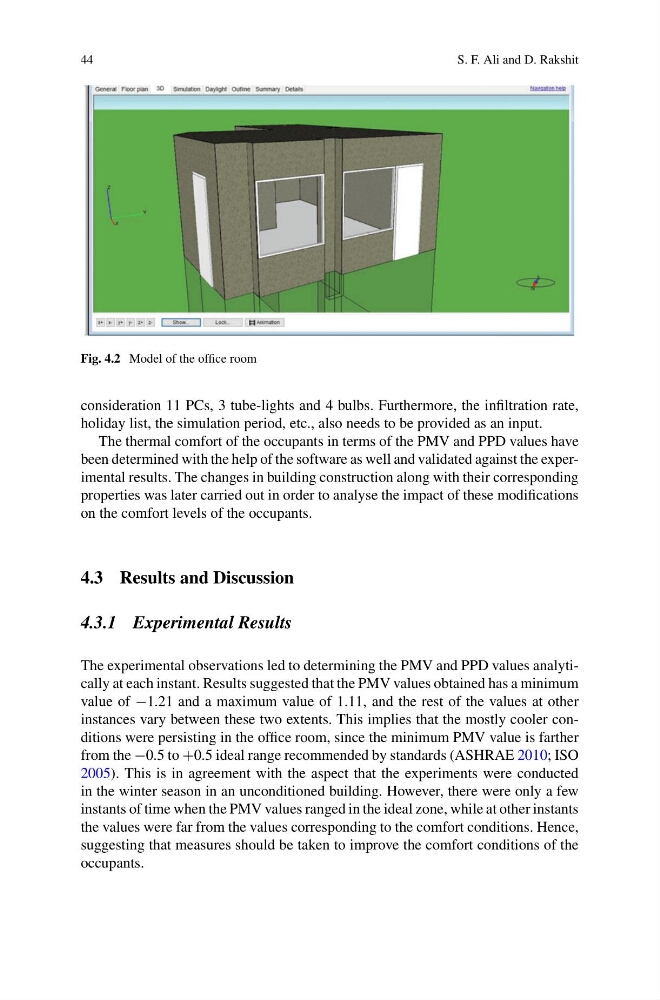
Fig. 4.2 Model of the office room
consideration 11 PCs, 3 tube-lights and 4 bulbs. Furthermore, the infiltration rate,
holiday list, the simulation period, etc., also needs to be provided as an input.
The thermal comfort of the occupants in terms of the PMV and PPD values have
been determined with the help of the software as well and validated against the experimental results. The changes in building construction along with their corresponding
properties was later carried out in order to analyse the impact of these modifications
on the comfort levels of the occupants.
4.3 Results and Discussion
4.3.1 Experimental Results
The experimental observations led to determining the PMV and PPD values analytically at each instant. Results suggested that the PMV values obtained has a minimum
value of −1.21 and a maximum value of 1.11, and the rest of the values at other
instances vary between these two extents. This implies that the mostly cooler conditions were persisting in the office room, since the minimum PMV value is farther
from the −0.5 to +0.5 ideal range recommended by standards (ASHRAE 2010; ISO
2005). This is in agreement with the aspect that the experiments were conducted
in the winter season in an unconditioned building. However, there were only a few
instants of time when the PMV values ranged in the ideal zone, while at other instants
the values were far from the values corresponding to the comfort conditions. Hence,
suggesting that measures should be taken to improve the comfort conditions of the
occupants.
S. F. Ali and D. Rakshit
Fig. 4.2 Model of the office room
consideration 11 PCs, 3 tube-lights and 4 bulbs. Furthermore, the infiltration rate,
holiday list, the simulation period, etc., also needs to be provided as an input.
The thermal comfort of the occupants in terms of the PMV and PPD values have
been determined with the help of the software as well and validated against the experimental results. The changes in building construction along with their corresponding
properties was later carried out in order to analyse the impact of these modifications
on the comfort levels of the occupants.
4.3 Results and Discussion
4.3.1 Experimental Results
The experimental observations led to determining the PMV and PPD values analytically at each instant. Results suggested that the PMV values obtained has a minimum
value of −1.21 and a maximum value of 1.11, and the rest of the values at other
instances vary between these two extents. This implies that the mostly cooler conditions were persisting in the office room, since the minimum PMV value is farther
from the −0.5 to +0.5 ideal range recommended by standards (ASHRAE 2010; ISO
2005). This is in agreement with the aspect that the experiments were conducted
in the winter season in an unconditioned building. However, there were only a few
instants of time when the PMV values ranged in the ideal zone, while at other instants
the values were far from the values corresponding to the comfort conditions. Hence,
suggesting that measures should be taken to improve the comfort conditions of the
occupants.