

4 Utilising Passive Design Strategies for Analysing Thermal …
41
where,
p s = e
16.6536−
4030.183
ta +235
(4.12)
Another term, v ar mentioned in the above equations can be found from Eq. (4.13):
v ar = v a + 0.005
M
A Du × 58
− 58.15
(4.13)
Here, the term A Du can be attained using Eq. (4.14):
A Du = (Ht.)
0.725
× (W t.)
0.425
× 0.007184
(4.14)
Additionally, another term used in the above mentioned equations is t cl , the value of
which, can be obtained using the iterative Eq. (4.15):
t cl = t sk − I cl × 3.96 × 10
−8
× f cl × [(t cl + 273)
4
− (t r + 273)
4
]
−I cl × f cl × h c × (t cl − t r )
(4.15)
where,
t sk = 35.7 − 0.028(M − W )
(4.16)
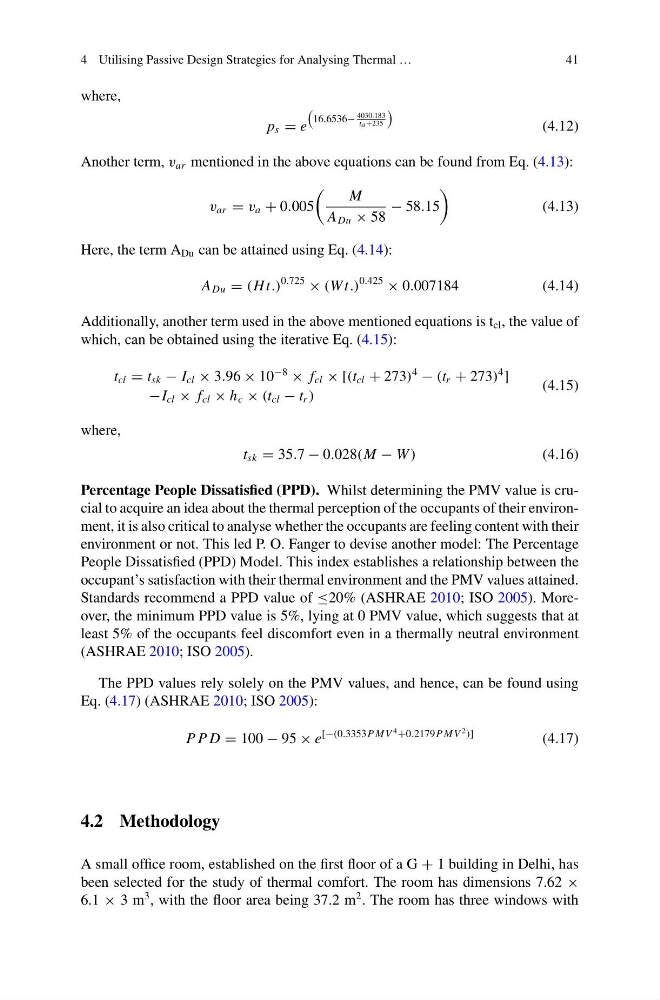
Percentage People Dissatisfied (PPD). Whilst determining the PMV value is crucial to acquire an idea about the thermal perception of the occupants of their environment, it is also critical to analyse whether the occupants are feeling content with their
environment or not. This led P. O. Fanger to devise another model: The Percentage
People Dissatisfied (PPD) Model. This index establishes a relationship between the
occupant’s satisfaction with their thermal environment and the PMV values attained.
Standards recommend a PPD value of ≤20% (ASHRAE 2010; ISO 2005). Moreover, the minimum PPD value is 5%, lying at 0 PMV value, which suggests that at
least 5% of the occupants feel discomfort even in a thermally neutral environment
(ASHRAE 2010; ISO 2005).
The PPD values rely solely on the PMV values, and hence, can be found using
Eq. (4.17) (ASHRAE 2010; ISO 2005):
P P D = 100 − 95 × e
[−(0.3353P MV
4 +0.2179P MV
2 )]
(4.17)
4.2 Methodology
A small office room, established on the first floor of a G + 1 building in Delhi, has
been selected for the study of thermal comfort. The room has dimensions 7.62 ×
6.1 × 3 m
3 , with the floor area being 37.2 m
2 . The room has three windows with
41
where,
p s = e
16.6536−
4030.183
ta +235
(4.12)
Another term, v ar mentioned in the above equations can be found from Eq. (4.13):
v ar = v a + 0.005
M
A Du × 58
− 58.15
(4.13)
Here, the term A Du can be attained using Eq. (4.14):
A Du = (Ht.)
0.725
× (W t.)
0.425
× 0.007184
(4.14)
Additionally, another term used in the above mentioned equations is t cl , the value of
which, can be obtained using the iterative Eq. (4.15):
t cl = t sk − I cl × 3.96 × 10
−8
× f cl × [(t cl + 273)
4
− (t r + 273)
4
]
−I cl × f cl × h c × (t cl − t r )
(4.15)
where,
t sk = 35.7 − 0.028(M − W )
(4.16)
Percentage People Dissatisfied (PPD). Whilst determining the PMV value is crucial to acquire an idea about the thermal perception of the occupants of their environment, it is also critical to analyse whether the occupants are feeling content with their
environment or not. This led P. O. Fanger to devise another model: The Percentage
People Dissatisfied (PPD) Model. This index establishes a relationship between the
occupant’s satisfaction with their thermal environment and the PMV values attained.
Standards recommend a PPD value of ≤20% (ASHRAE 2010; ISO 2005). Moreover, the minimum PPD value is 5%, lying at 0 PMV value, which suggests that at
least 5% of the occupants feel discomfort even in a thermally neutral environment
(ASHRAE 2010; ISO 2005).
The PPD values rely solely on the PMV values, and hence, can be found using
Eq. (4.17) (ASHRAE 2010; ISO 2005):
P P D = 100 − 95 × e
[−(0.3353P MV
4 +0.2179P MV
2 )]
(4.17)
4.2 Methodology
A small office room, established on the first floor of a G + 1 building in Delhi, has
been selected for the study of thermal comfort. The room has dimensions 7.62 ×
6.1 × 3 m
3 , with the floor area being 37.2 m
2 . The room has three windows with