

264
R. Saxena et al.
5
10
15
20
25
30
35
40
45
Jan Feb Mar Apr May Jun Jul Aug Sep Oct Nov Dec
Temperature (°C)
Mean Max.
Temp. (°C)
Mean Min.
Temp. (°C)
New Delhi
Months
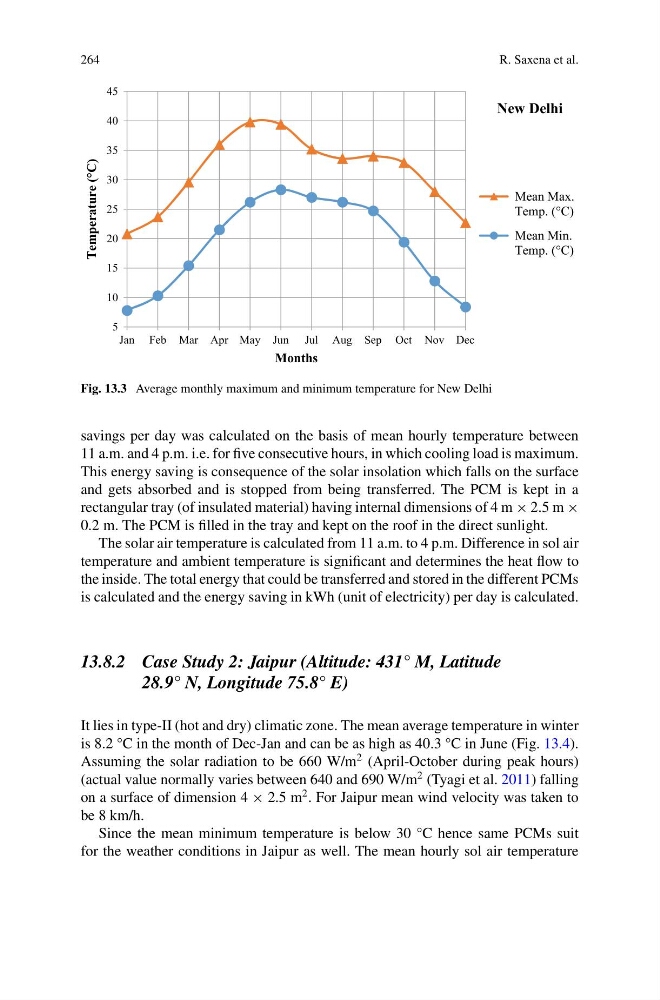
Fig. 13.3 Average monthly maximum and minimum temperature for New Delhi
savings per day was calculated on the basis of mean hourly temperature between
11 a.m. and 4 p.m. i.e. for five consecutive hours, in which cooling load is maximum.
This energy saving is consequence of the solar insolation which falls on the surface
and gets absorbed and is stopped from being transferred. The PCM is kept in a
rectangular tray (of insulated material) having internal dimensions of 4 m × 2.5 m ×
0.2 m. The PCM is filled in the tray and kept on the roof in the direct sunlight.
The solar air temperature is calculated from 11 a.m. to 4 p.m. Difference in sol air
temperature and ambient temperature is significant and determines the heat flow to
the inside. The total energy that could be transferred and stored in the different PCMs
is calculated and the energy saving in kWh (unit of electricity) per day is calculated.
13.8.2 Case Study 2: Jaipur (Altitude: 431° M, Latitude
28.9° N, Longitude 75.8° E)
It lies in type-II (hot and dry) climatic zone. The mean average temperature in winter
is 8.2 °C in the month of Dec-Jan and can be as high as 40.3 °C in June (Fig. 13.4).
Assuming the solar radiation to be 660 W/m
2 (April-October during peak hours)
(actual value normally varies between 640 and 690 W/m
2 (Tyagi et al. 2011) falling
on a surface of dimension 4 × 2.5 m
2 . For Jaipur mean wind velocity was taken to
be 8 km/h.
Since the mean minimum temperature is below 30 °C hence same PCMs suit
for the weather conditions in Jaipur as well. The mean hourly sol air temperature
R. Saxena et al.
5
10
15
20
25
30
35
40
45
Jan Feb Mar Apr May Jun Jul Aug Sep Oct Nov Dec
Temperature (°C)
Mean Max.
Temp. (°C)
Mean Min.
Temp. (°C)
New Delhi
Months
Fig. 13.3 Average monthly maximum and minimum temperature for New Delhi
savings per day was calculated on the basis of mean hourly temperature between
11 a.m. and 4 p.m. i.e. for five consecutive hours, in which cooling load is maximum.
This energy saving is consequence of the solar insolation which falls on the surface
and gets absorbed and is stopped from being transferred. The PCM is kept in a
rectangular tray (of insulated material) having internal dimensions of 4 m × 2.5 m ×
0.2 m. The PCM is filled in the tray and kept on the roof in the direct sunlight.
The solar air temperature is calculated from 11 a.m. to 4 p.m. Difference in sol air
temperature and ambient temperature is significant and determines the heat flow to
the inside. The total energy that could be transferred and stored in the different PCMs
is calculated and the energy saving in kWh (unit of electricity) per day is calculated.
13.8.2 Case Study 2: Jaipur (Altitude: 431° M, Latitude
28.9° N, Longitude 75.8° E)
It lies in type-II (hot and dry) climatic zone. The mean average temperature in winter
is 8.2 °C in the month of Dec-Jan and can be as high as 40.3 °C in June (Fig. 13.4).
Assuming the solar radiation to be 660 W/m
2 (April-October during peak hours)
(actual value normally varies between 640 and 690 W/m
2 (Tyagi et al. 2011) falling
on a surface of dimension 4 × 2.5 m
2 . For Jaipur mean wind velocity was taken to
be 8 km/h.
Since the mean minimum temperature is below 30 °C hence same PCMs suit
for the weather conditions in Jaipur as well. The mean hourly sol air temperature