

13 Review on PCM Application for Cooling Load Reduction …
265
5
10
15
20
25
30
35
40
45
Jan Feb Mar Apr May Jun Jul Aug Sep Oct Nov Dec
Temperature (°C)
Mean Max.
Temp. (°C)
Mean Min.
Temp. (°C)
Jaipur
Months
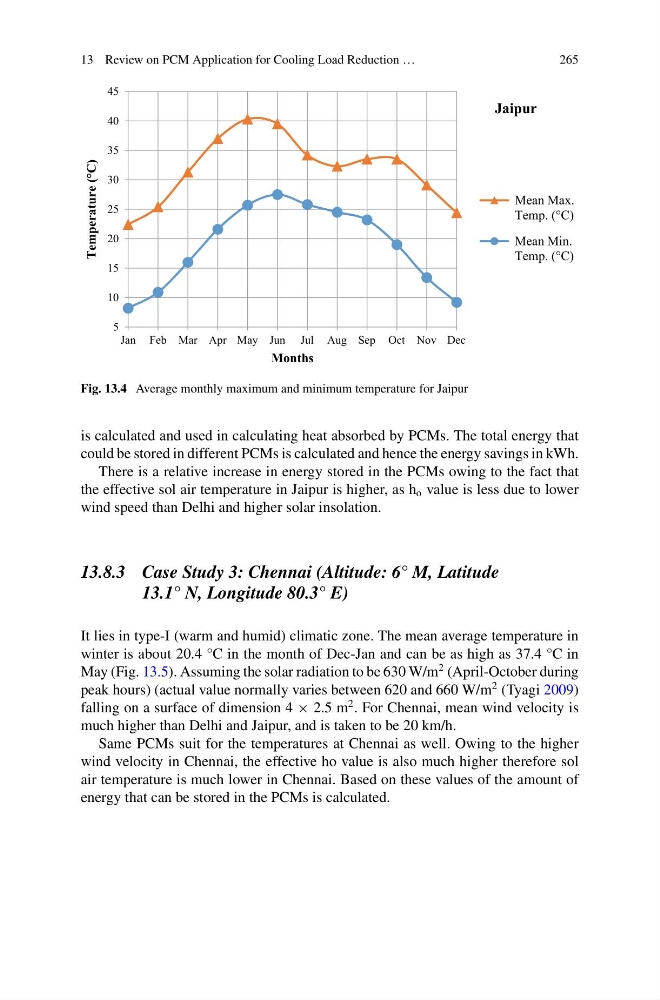
Fig. 13.4 Average monthly maximum and minimum temperature for Jaipur
is calculated and used in calculating heat absorbed by PCMs. The total energy that
could be stored in different PCMs is calculated and hence the energy savings in kWh.
There is a relative increase in energy stored in the PCMs owing to the fact that
the effective sol air temperature in Jaipur is higher, as h o value is less due to lower
wind speed than Delhi and higher solar insolation.
13.8.3 Case Study 3: Chennai (Altitude: 6° M, Latitude
13.1° N, Longitude 80.3° E)
It lies in type-I (warm and humid) climatic zone. The mean average temperature in
winter is about 20.4 °C in the month of Dec-Jan and can be as high as 37.4 °C in
May (Fig. 13.5). Assuming the solar radiation to be 630 W/m
2 (April-October during
peak hours) (actual value normally varies between 620 and 660 W/m
2 (Tyagi 2009)
falling on a surface of dimension 4 × 2.5 m
2 . For Chennai, mean wind velocity is
much higher than Delhi and Jaipur, and is taken to be 20 km/h.
Same PCMs suit for the temperatures at Chennai as well. Owing to the higher
wind velocity in Chennai, the effective ho value is also much higher therefore sol
air temperature is much lower in Chennai. Based on these values of the amount of
energy that can be stored in the PCMs is calculated.
265
5
10
15
20
25
30
35
40
45
Jan Feb Mar Apr May Jun Jul Aug Sep Oct Nov Dec
Temperature (°C)
Mean Max.
Temp. (°C)
Mean Min.
Temp. (°C)
Jaipur
Months
Fig. 13.4 Average monthly maximum and minimum temperature for Jaipur
is calculated and used in calculating heat absorbed by PCMs. The total energy that
could be stored in different PCMs is calculated and hence the energy savings in kWh.
There is a relative increase in energy stored in the PCMs owing to the fact that
the effective sol air temperature in Jaipur is higher, as h o value is less due to lower
wind speed than Delhi and higher solar insolation.
13.8.3 Case Study 3: Chennai (Altitude: 6° M, Latitude
13.1° N, Longitude 80.3° E)
It lies in type-I (warm and humid) climatic zone. The mean average temperature in
winter is about 20.4 °C in the month of Dec-Jan and can be as high as 37.4 °C in
May (Fig. 13.5). Assuming the solar radiation to be 630 W/m
2 (April-October during
peak hours) (actual value normally varies between 620 and 660 W/m
2 (Tyagi 2009)
falling on a surface of dimension 4 × 2.5 m
2 . For Chennai, mean wind velocity is
much higher than Delhi and Jaipur, and is taken to be 20 km/h.
Same PCMs suit for the temperatures at Chennai as well. Owing to the higher
wind velocity in Chennai, the effective ho value is also much higher therefore sol
air temperature is much lower in Chennai. Based on these values of the amount of
energy that can be stored in the PCMs is calculated.