

6 Multi-objective Performance Optimization of a Ribbed Solar …
91
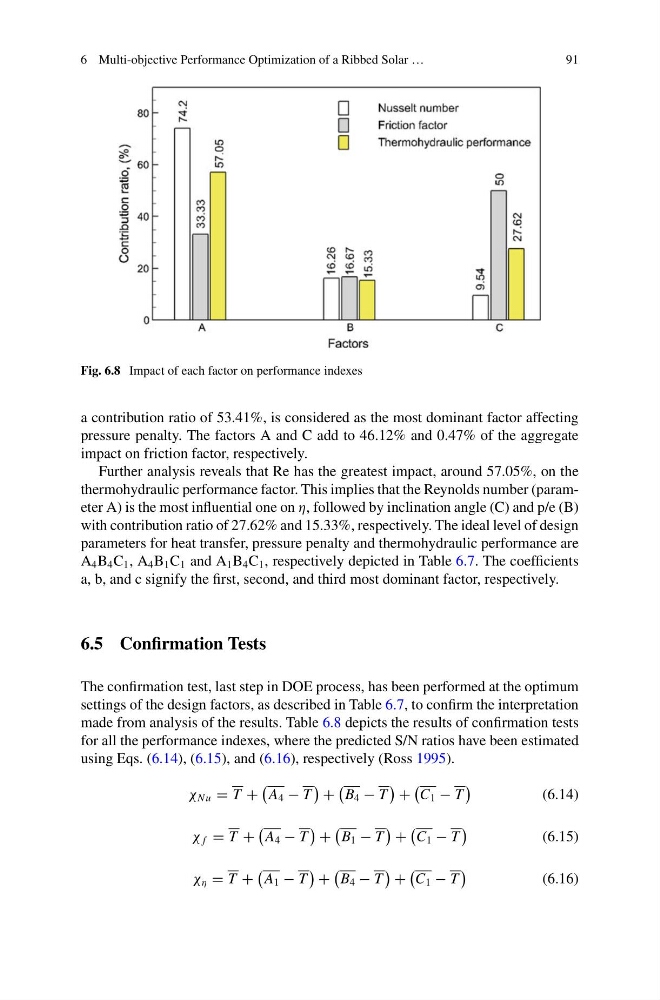
Fig. 6.8 Impact of each factor on performance indexes
a contribution ratio of 53.41%, is considered as the most dominant factor affecting
pressure penalty. The factors A and C add to 46.12% and 0.47% of the aggregate
impact on friction factor, respectively.
Further analysis reveals that Re has the greatest impact, around 57.05%, on the
thermohydraulic performance factor. This implies that the Reynolds number (parameter A) is the most influential one on η, followed by inclination angle (C) and p/e (B)
with contribution ratio of 27.62% and 15.33%, respectively. The ideal level of design
parameters for heat transfer, pressure penalty and thermohydraulic performance are
A 4 B 4 C 1 , A 4 B 1 C 1 and A 1 B 4 C 1 , respectively depicted in Table 6.7. The coefficients
a, b, and c signify the first, second, and third most dominant factor, respectively.
6.5 Confirmation Tests
The confirmation test, last step in DOE process, has been performed at the optimum
settings of the design factors, as described in Table 6.7, to confirm the interpretation
made from analysis of the results. Table 6.8 depicts the results of confirmation tests
for all the performance indexes, where the predicted S/N ratios have been estimated
using Eqs. (6.14), (6.15), and (6.16), respectively (Ross 1995).
χ Nu = T +
A 4 − T
+
B 4 − T
+
C 1 − T
(6.14)
χ f = T +
A 4 − T
+
B 1 − T
+
C 1 − T
(6.15)
χ η = T +
A 1 − T
+
B 4 − T
+
C 1 − T
(6.16)
91
Fig. 6.8 Impact of each factor on performance indexes
a contribution ratio of 53.41%, is considered as the most dominant factor affecting
pressure penalty. The factors A and C add to 46.12% and 0.47% of the aggregate
impact on friction factor, respectively.
Further analysis reveals that Re has the greatest impact, around 57.05%, on the
thermohydraulic performance factor. This implies that the Reynolds number (parameter A) is the most influential one on η, followed by inclination angle (C) and p/e (B)
with contribution ratio of 27.62% and 15.33%, respectively. The ideal level of design
parameters for heat transfer, pressure penalty and thermohydraulic performance are
A 4 B 4 C 1 , A 4 B 1 C 1 and A 1 B 4 C 1 , respectively depicted in Table 6.7. The coefficients
a, b, and c signify the first, second, and third most dominant factor, respectively.
6.5 Confirmation Tests
The confirmation test, last step in DOE process, has been performed at the optimum
settings of the design factors, as described in Table 6.7, to confirm the interpretation
made from analysis of the results. Table 6.8 depicts the results of confirmation tests
for all the performance indexes, where the predicted S/N ratios have been estimated
using Eqs. (6.14), (6.15), and (6.16), respectively (Ross 1995).
χ Nu = T +
A 4 − T
+
B 4 − T
+
C 1 − T
(6.14)
χ f = T +
A 4 − T
+
B 1 − T
+
C 1 − T
(6.15)
χ η = T +
A 1 − T
+
B 4 − T
+
C 1 − T
(6.16)