

90
N. Sharma and R. Choudhary
4
3
2
1
7.5
7.0
6.5
6.0
5.5
5.0
4
3
2
1
4
3
2
1
A
Mean of SN ratios
B
C
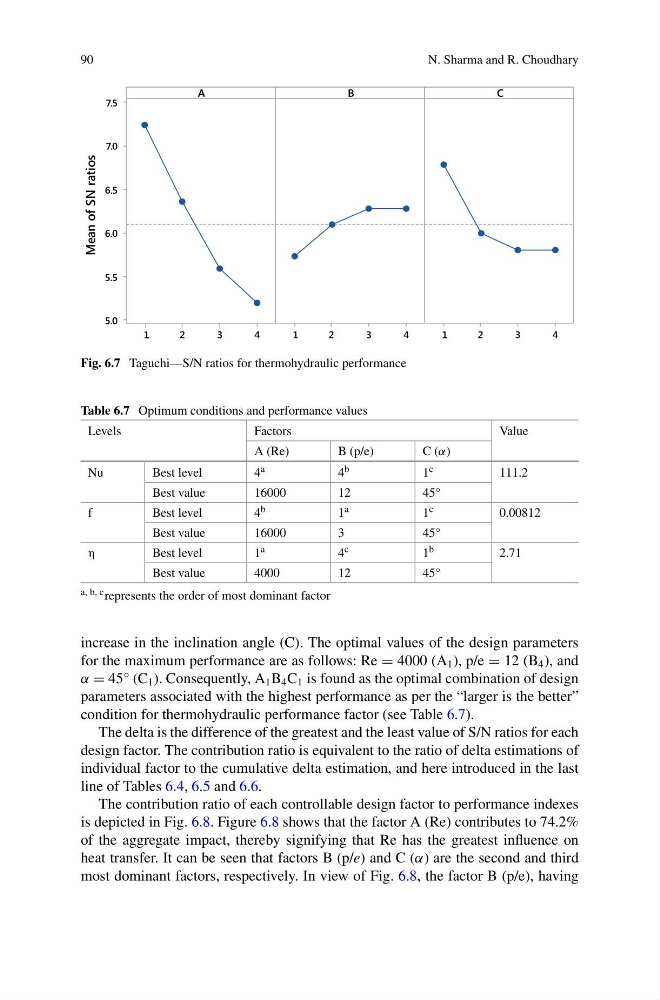
Fig. 6.7 Taguchi—S/N ratios for thermohydraulic performance
Table 6.7 Optimum conditions and performance values
Levels
Factors
Value
A (Re)
B (p/e)
C (α)
Nu
Best level
4 a
4 b
1 c
111.2
Best value
16000
12
45°
f
Best level
4 b
1 a
1 c
0.00812
Best value
16000
3
45°
η
Best level
1 a
4 c
1 b
2.71
Best value
4000
12
45°
a, b, c represents the order of most dominant factor
increase in the inclination angle (C). The optimal values of the design parameters
for the maximum performance are as follows: Re = 4000 (A 1 ), p/e = 12 (B 4 ), and
α = 45° (C 1 ). Consequently, A 1 B 4 C 1 is found as the optimal combination of design
parameters associated with the highest performance as per the “larger is the better”
condition for thermohydraulic performance factor (see Table 6.7).
The delta is the difference of the greatest and the least value of S/N ratios for each
design factor. The contribution ratio is equivalent to the ratio of delta estimations of
individual factor to the cumulative delta estimation, and here introduced in the last
line of Tables 6.4, 6.5 and 6.6.
The contribution ratio of each controllable design factor to performance indexes
is depicted in Fig. 6.8. Figure 6.8 shows that the factor A (Re) contributes to 74.2%
of the aggregate impact, thereby signifying that Re has the greatest influence on
heat transfer. It can be seen that factors B (p/e) and C (α) are the second and third
most dominant factors, respectively. In view of Fig. 6.8, the factor B (p/e), having
N. Sharma and R. Choudhary
4
3
2
1
7.5
7.0
6.5
6.0
5.5
5.0
4
3
2
1
4
3
2
1
A
Mean of SN ratios
B
C
Fig. 6.7 Taguchi—S/N ratios for thermohydraulic performance
Table 6.7 Optimum conditions and performance values
Levels
Factors
Value
A (Re)
B (p/e)
C (α)
Nu
Best level
4 a
4 b
1 c
111.2
Best value
16000
12
45°
f
Best level
4 b
1 a
1 c
0.00812
Best value
16000
3
45°
η
Best level
1 a
4 c
1 b
2.71
Best value
4000
12
45°
a, b, c represents the order of most dominant factor
increase in the inclination angle (C). The optimal values of the design parameters
for the maximum performance are as follows: Re = 4000 (A 1 ), p/e = 12 (B 4 ), and
α = 45° (C 1 ). Consequently, A 1 B 4 C 1 is found as the optimal combination of design
parameters associated with the highest performance as per the “larger is the better”
condition for thermohydraulic performance factor (see Table 6.7).
The delta is the difference of the greatest and the least value of S/N ratios for each
design factor. The contribution ratio is equivalent to the ratio of delta estimations of
individual factor to the cumulative delta estimation, and here introduced in the last
line of Tables 6.4, 6.5 and 6.6.
The contribution ratio of each controllable design factor to performance indexes
is depicted in Fig. 6.8. Figure 6.8 shows that the factor A (Re) contributes to 74.2%
of the aggregate impact, thereby signifying that Re has the greatest influence on
heat transfer. It can be seen that factors B (p/e) and C (α) are the second and third
most dominant factors, respectively. In view of Fig. 6.8, the factor B (p/e), having