

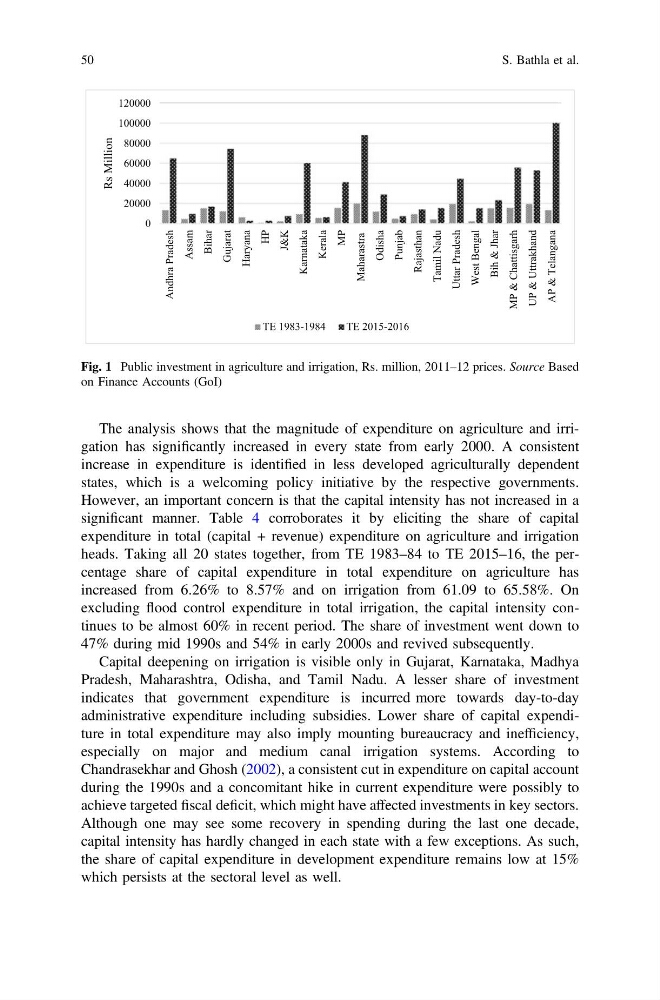
The analysis shows that the magnitude of expenditure on agriculture and irrigation has significantly increased in every state from early 2000. A consistent
increase in expenditure is identified in less developed agriculturally dependent
states, which is a welcoming policy initiative by the respective governments.
However, an important concern is that the capital intensity has not increased in a
significant manner. Table 4 corroborates it by eliciting the share of capital
expenditure in total (capital + revenue) expenditure on agriculture and irrigation
heads. Taking all 20 states together, from TE 1983–84 to TE 2015–16, the percentage share of capital expenditure in total expenditure on agriculture has
increased from 6.26% to 8.57% and on irrigation from 61.09 to 65.58%. On
excluding flood control expenditure in total irrigation, the capital intensity continues to be almost 60% in recent period. The share of investment went down to
47% during mid 1990s and 54% in early 2000s and revived subsequently.
Capital deepening on irrigation is visible only in Gujarat, Karnataka, Madhya
Pradesh, Maharashtra, Odisha, and Tamil Nadu. A lesser share of investment
indicates that government expenditure is incurred more towards day-to-day
administrative expenditure including subsidies. Lower share of capital expenditure in total expenditure may also imply mounting bureaucracy and inefficiency,
especially on major and medium canal irrigation systems. According to
Chandrasekhar and Ghosh (2002), a consistent cut in expenditure on capital account
during the 1990s and a concomitant hike in current expenditure were possibly to
achieve targeted fiscal deficit, which might have affected investments in key sectors.
Although one may see some recovery in spending during the last one decade,
capital intensity has hardly changed in each state with a few exceptions. As such,
the share of capital expenditure in development expenditure remains low at 15%
which persists at the sectoral level as well.
0
20000
40000
60000
80000
100000
120000
Andhra Pradesh
Assam
Bihar
Gujarat
Haryana
HP
J&K
Karnataka
Kerala
MP
Maharastra
Odisha
Punjab
Rajasthan
Tamil Nadu
Uttar Pradesh
West Bengal
Bih & Jhar
MP & Chattisgarh
UP & Uttrakhand
AP & Telangana
Rs Million
TE 1983-1984
TE 2015-2016
Fig. 1 Public investment in agriculture and irrigation, Rs. million, 2011–12 prices. Source Based
on Finance Accounts (GoI)
50
S. Bathla et al.
increase in expenditure is identified in less developed agriculturally dependent
states, which is a welcoming policy initiative by the respective governments.
However, an important concern is that the capital intensity has not increased in a
significant manner. Table 4 corroborates it by eliciting the share of capital
expenditure in total (capital + revenue) expenditure on agriculture and irrigation
heads. Taking all 20 states together, from TE 1983–84 to TE 2015–16, the percentage share of capital expenditure in total expenditure on agriculture has
increased from 6.26% to 8.57% and on irrigation from 61.09 to 65.58%. On
excluding flood control expenditure in total irrigation, the capital intensity continues to be almost 60% in recent period. The share of investment went down to
47% during mid 1990s and 54% in early 2000s and revived subsequently.
Capital deepening on irrigation is visible only in Gujarat, Karnataka, Madhya
Pradesh, Maharashtra, Odisha, and Tamil Nadu. A lesser share of investment
indicates that government expenditure is incurred more towards day-to-day
administrative expenditure including subsidies. Lower share of capital expenditure in total expenditure may also imply mounting bureaucracy and inefficiency,
especially on major and medium canal irrigation systems. According to
Chandrasekhar and Ghosh (2002), a consistent cut in expenditure on capital account
during the 1990s and a concomitant hike in current expenditure were possibly to
achieve targeted fiscal deficit, which might have affected investments in key sectors.
Although one may see some recovery in spending during the last one decade,
capital intensity has hardly changed in each state with a few exceptions. As such,
the share of capital expenditure in development expenditure remains low at 15%
which persists at the sectoral level as well.
0
20000
40000
60000
80000
100000
120000
Andhra Pradesh
Assam
Bihar
Gujarat
Haryana
HP
J&K
Karnataka
Kerala
MP
Maharastra
Odisha
Punjab
Rajasthan
Tamil Nadu
Uttar Pradesh
West Bengal
Bih & Jhar
MP & Chattisgarh
UP & Uttrakhand
AP & Telangana
Rs Million
TE 1983-1984
TE 2015-2016
Fig. 1 Public investment in agriculture and irrigation, Rs. million, 2011–12 prices. Source Based
on Finance Accounts (GoI)
50
S. Bathla et al.