

Further, among various types of irrigation expenditures, the maximum share is
occupied by medium and major irrigation systems. On an average, this head of
expenditure constitutes a sizeable share (40%) in total irrigation expenditure, which
may be due to AIBP providing grant-based funds and also provision of PM package
for distressed areas. The state governments have allocated outlays with a completion target by June 2020. In phase—II probably starting from 2020, nearly seven
hundred more dams will be added to the list for implementation across 18 states.
The analysis further shows that the government in less developed states spends
more on minor irrigation having 27.68% share in total irrigation expenditure during
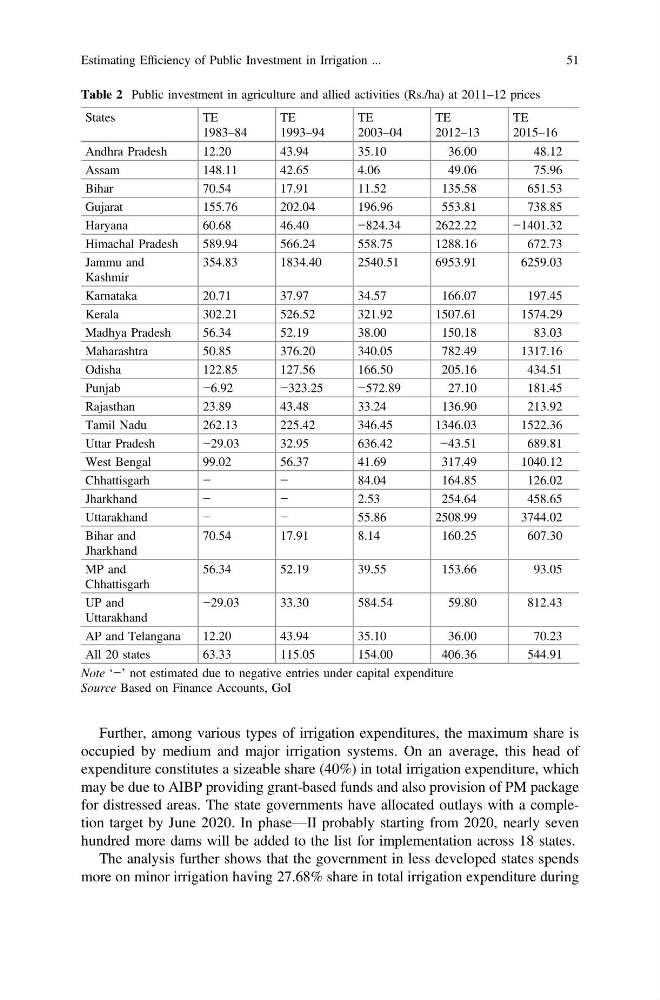
Table 2 Public investment in agriculture and allied activities (Rs./ha) at 2011–12 prices
States
TE
1983–84
TE
1993–94
TE
2003–04
TE
2012–13
TE
2015–16
Andhra Pradesh
12.20
43.94
35.10
36.00
48.12
Assam
148.11
42.65
4.06
49.06
75.96
Bihar
70.54
17.91
11.52
135.58
651.53
Gujarat
155.76
202.04
196.96
553.81
738.85
Haryana
60.68
46.40
−824.34
2622.22
−1401.32
Himachal Pradesh
589.94
566.24
558.75
1288.16
672.73
Jammu and
Kashmir
354.83
1834.40
2540.51
6953.91
6259.03
Karnataka
20.71
37.97
34.57
166.07
197.45
Kerala
302.21
526.52
321.92
1507.61
1574.29
Madhya Pradesh
56.34
52.19
38.00
150.18
83.03
Maharashtra
50.85
376.20
340.05
782.49
1317.16
Odisha
122.85
127.56
166.50
205.16
434.51
Punjab
−6.92
−323.25
−572.89
27.10
181.45
Rajasthan
23.89
43.48
33.24
136.90
213.92
Tamil Nadu
262.13
225.42
346.45
1346.03
1522.36
Uttar Pradesh
−29.03
32.95
636.42
−43.51
689.81
West Bengal
99.02
56.37
41.69
317.49
1040.12
Chhattisgarh
−
−
84.04
164.85
126.02
Jharkhand
−
−
2.53
254.64
458.65
Uttarakhand
−
−
55.86
2508.99
3744.02
Bihar and
Jharkhand
70.54
17.91
8.14
160.25
607.30
MP and
Chhattisgarh
56.34
52.19
39.55
153.66
93.05
UP and
Uttarakhand
−29.03
33.30
584.54
59.80
812.43
AP and Telangana
12.20
43.94
35.10
36.00
70.23
All 20 states
63.33
115.05
154.00
406.36
544.91
Note ‘−’ not estimated due to negative entries under capital expenditure
Source Based on Finance Accounts, GoI
Estimating Efficiency of Public Investment in Irrigation ...
51
occupied by medium and major irrigation systems. On an average, this head of
expenditure constitutes a sizeable share (40%) in total irrigation expenditure, which
may be due to AIBP providing grant-based funds and also provision of PM package
for distressed areas. The state governments have allocated outlays with a completion target by June 2020. In phase—II probably starting from 2020, nearly seven
hundred more dams will be added to the list for implementation across 18 states.
The analysis further shows that the government in less developed states spends
more on minor irrigation having 27.68% share in total irrigation expenditure during
Table 2 Public investment in agriculture and allied activities (Rs./ha) at 2011–12 prices
States
TE
1983–84
TE
1993–94
TE
2003–04
TE
2012–13
TE
2015–16
Andhra Pradesh
12.20
43.94
35.10
36.00
48.12
Assam
148.11
42.65
4.06
49.06
75.96
Bihar
70.54
17.91
11.52
135.58
651.53
Gujarat
155.76
202.04
196.96
553.81
738.85
Haryana
60.68
46.40
−824.34
2622.22
−1401.32
Himachal Pradesh
589.94
566.24
558.75
1288.16
672.73
Jammu and
Kashmir
354.83
1834.40
2540.51
6953.91
6259.03
Karnataka
20.71
37.97
34.57
166.07
197.45
Kerala
302.21
526.52
321.92
1507.61
1574.29
Madhya Pradesh
56.34
52.19
38.00
150.18
83.03
Maharashtra
50.85
376.20
340.05
782.49
1317.16
Odisha
122.85
127.56
166.50
205.16
434.51
Punjab
−6.92
−323.25
−572.89
27.10
181.45
Rajasthan
23.89
43.48
33.24
136.90
213.92
Tamil Nadu
262.13
225.42
346.45
1346.03
1522.36
Uttar Pradesh
−29.03
32.95
636.42
−43.51
689.81
West Bengal
99.02
56.37
41.69
317.49
1040.12
Chhattisgarh
−
−
84.04
164.85
126.02
Jharkhand
−
−
2.53
254.64
458.65
Uttarakhand
−
−
55.86
2508.99
3744.02
Bihar and
Jharkhand
70.54
17.91
8.14
160.25
607.30
MP and
Chhattisgarh
56.34
52.19
39.55
153.66
93.05
UP and
Uttarakhand
−29.03
33.30
584.54
59.80
812.43
AP and Telangana
12.20
43.94
35.10
36.00
70.23
All 20 states
63.33
115.05
154.00
406.36
544.91
Note ‘−’ not estimated due to negative entries under capital expenditure
Source Based on Finance Accounts, GoI
Estimating Efficiency of Public Investment in Irrigation ...
51