

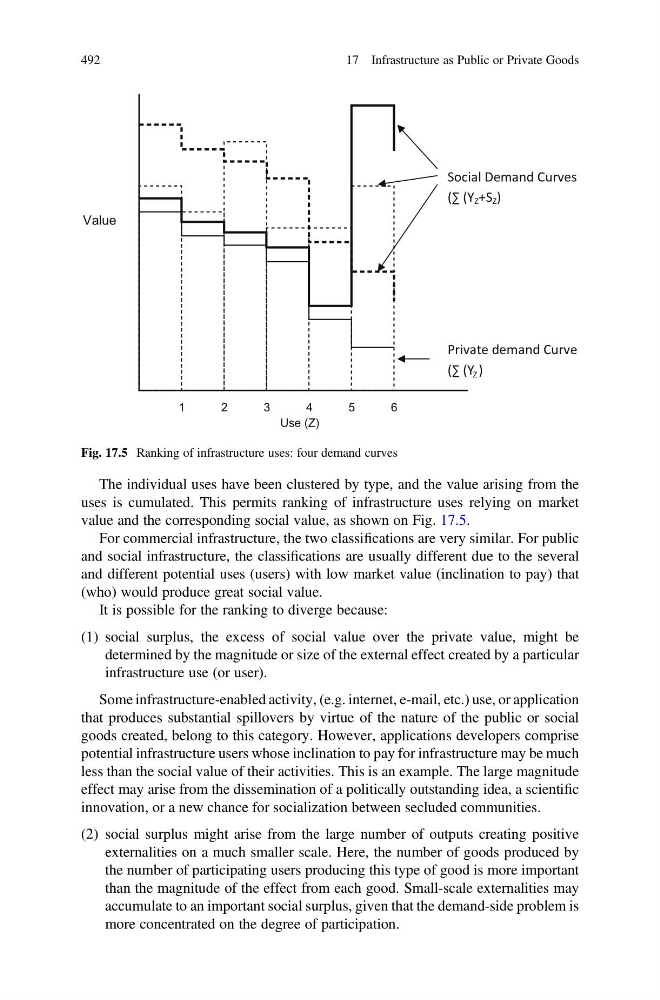
The individual uses have been clustered by type, and the value arising from the
uses is cumulated. This permits ranking of infrastructure uses relying on market
value and the corresponding social value, as shown on Fig. 17.5.
For commercial infrastructure, the two classifications are very similar. For public
and social infrastructure, the classifications are usually different due to the several
and different potential uses (users) with low market value (inclination to pay) that
(who) would produce great social value.
It is possible for the ranking to diverge because:
(1) social surplus, the excess of social value over the private value, might be
determined by the magnitude or size of the external effect created by a particular
infrastructure use (or user).
Some infrastructure-enabled activity, (e.g. internet, e-mail, etc.) use, or application
that produces substantial spillovers by virtue of the nature of the public or social
goods created, belong to this category. However, applications developers comprise
potential infrastructure users whose inclination to pay for infrastructure may be much
less than the social value of their activities. This is an example. The large magnitude
effect may arise from the dissemination of a politically outstanding idea, a scientific
innovation, or a new chance for socialization between secluded communities.
(2) social surplus might arise from the large number of outputs creating positive
externalities on a much smaller scale. Here, the number of goods produced by
the number of participating users producing this type of good is more important
than the magnitude of the effect from each good. Small-scale externalities may
accumulate to an important social surplus, given that the demand-side problem is
more concentrated on the degree of participation.
1
2
3
4
5
6
Use (Z)
Social Demand Curves
(∑ (Y Z
Z
+S Z )
Private demand Curve
(∑ (Y )
Value
Fig. 17.5 Ranking of infrastructure uses: four demand curves
492
17 Infrastructure as Public or Private Goods
uses is cumulated. This permits ranking of infrastructure uses relying on market
value and the corresponding social value, as shown on Fig. 17.5.
For commercial infrastructure, the two classifications are very similar. For public
and social infrastructure, the classifications are usually different due to the several
and different potential uses (users) with low market value (inclination to pay) that
(who) would produce great social value.
It is possible for the ranking to diverge because:
(1) social surplus, the excess of social value over the private value, might be
determined by the magnitude or size of the external effect created by a particular
infrastructure use (or user).
Some infrastructure-enabled activity, (e.g. internet, e-mail, etc.) use, or application
that produces substantial spillovers by virtue of the nature of the public or social
goods created, belong to this category. However, applications developers comprise
potential infrastructure users whose inclination to pay for infrastructure may be much
less than the social value of their activities. This is an example. The large magnitude
effect may arise from the dissemination of a politically outstanding idea, a scientific
innovation, or a new chance for socialization between secluded communities.
(2) social surplus might arise from the large number of outputs creating positive
externalities on a much smaller scale. Here, the number of goods produced by
the number of participating users producing this type of good is more important
than the magnitude of the effect from each good. Small-scale externalities may
accumulate to an important social surplus, given that the demand-side problem is
more concentrated on the degree of participation.
1
2
3
4
5
6
Use (Z)
Social Demand Curves
(∑ (Y Z
Z
+S Z )
Private demand Curve
(∑ (Y )
Value
Fig. 17.5 Ranking of infrastructure uses: four demand curves
492
17 Infrastructure as Public or Private Goods