

right. Similarly, for public/social infrastructure, the demand curve again depicts the
users’ preparedness to pay and classifies individual uses depending on private value
from left to right, but this classification does not necessarily match social value
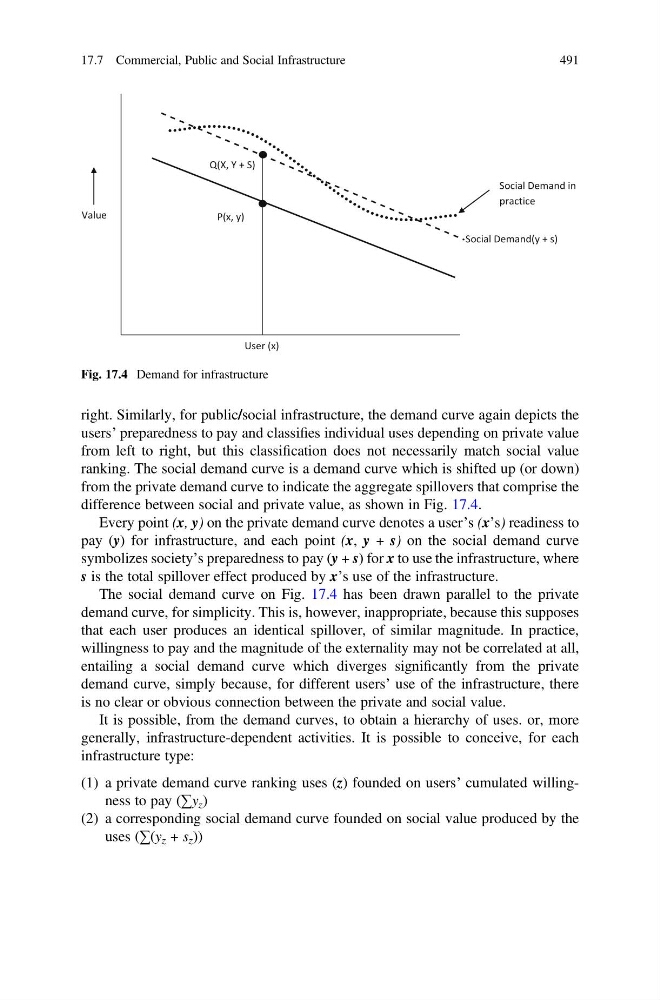
ranking. The social demand curve is a demand curve which is shifted up (or down)
from the private demand curve to indicate the aggregate spillovers that comprise the
difference between social and private value, as shown in Fig. 17.4.
Every point (x, y) on the private demand curve denotes a user’s (x’s) readiness to
pay (y) for infrastructure, and each point (x, y + s) on the social demand curve
symbolizes society’s preparedness to pay (y + s) for x to use the infrastructure, where
s is the total spillover effect produced by x’s use of the infrastructure.
The social demand curve on Fig. 17.4 has been drawn parallel to the private
demand curve, for simplicity. This is, however, inappropriate, because this supposes
that each user produces an identical spillover, of similar magnitude. In practice,
willingness to pay and the magnitude of the externality may not be correlated at all,
entailing a social demand curve which diverges significantly from the private
demand curve, simply because, for different users’ use of the infrastructure, there
is no clear or obvious connection between the private and social value.
It is possible, from the demand curves, to obtain a hierarchy of uses. or, more
generally, infrastructure-dependent activities. It is possible to conceive, for each
infrastructure type:
(1) a private demand curve ranking uses (z) founded on users’ cumulated willingness to pay (∑y z )
(2) a corresponding social demand curve founded on social value produced by the
uses (∑(y z + s z ))
Value
User (x)
P(x, y)
Social Demand(y + s)
Q(X, Y + S)
Social Demand in
practice
Fig. 17.4 Demand for infrastructure
17.7 Commercial, Public and Social Infrastructure
491
users’ preparedness to pay and classifies individual uses depending on private value
from left to right, but this classification does not necessarily match social value
ranking. The social demand curve is a demand curve which is shifted up (or down)
from the private demand curve to indicate the aggregate spillovers that comprise the
difference between social and private value, as shown in Fig. 17.4.
Every point (x, y) on the private demand curve denotes a user’s (x’s) readiness to
pay (y) for infrastructure, and each point (x, y + s) on the social demand curve
symbolizes society’s preparedness to pay (y + s) for x to use the infrastructure, where
s is the total spillover effect produced by x’s use of the infrastructure.
The social demand curve on Fig. 17.4 has been drawn parallel to the private
demand curve, for simplicity. This is, however, inappropriate, because this supposes
that each user produces an identical spillover, of similar magnitude. In practice,
willingness to pay and the magnitude of the externality may not be correlated at all,
entailing a social demand curve which diverges significantly from the private
demand curve, simply because, for different users’ use of the infrastructure, there
is no clear or obvious connection between the private and social value.
It is possible, from the demand curves, to obtain a hierarchy of uses. or, more
generally, infrastructure-dependent activities. It is possible to conceive, for each
infrastructure type:
(1) a private demand curve ranking uses (z) founded on users’ cumulated willingness to pay (∑y z )
(2) a corresponding social demand curve founded on social value produced by the
uses (∑(y z + s z ))
Value
User (x)
P(x, y)
Social Demand(y + s)
Q(X, Y + S)
Social Demand in
practice
Fig. 17.4 Demand for infrastructure
17.7 Commercial, Public and Social Infrastructure
491