

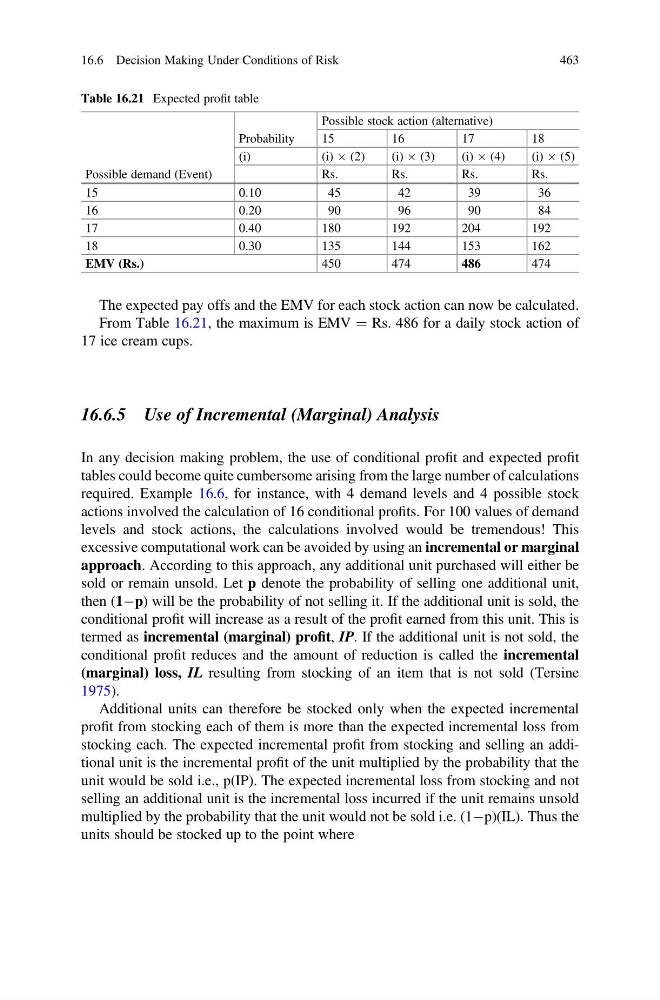
The expected pay offs and the EMV for each stock action can now be calculated.
From Table 16.21, the maximum is EMV ¼ Rs. 486 for a daily stock action of
17 ice cream cups.
16.6.5 Use of Incremental (Marginal) Analysis
In any decision making problem, the use of conditional profit and expected profit
tables could become quite cumbersome arising from the large number of calculations
required. Example 16.6, for instance, with 4 demand levels and 4 possible stock
actions involved the calculation of 16 conditional profits. For 100 values of demand
levels and stock actions, the calculations involved would be tremendous! This
excessive computational work can be avoided by using an incremental or marginal
approach. According to this approach, any additional unit purchased will either be
sold or remain unsold. Let p denote the probability of selling one additional unit,
then (1Àp) will be the probability of not selling it. If the additional unit is sold, the
conditional profit will increase as a result of the profit earned from this unit. This is
termed as incremental (marginal) profit, IP. If the additional unit is not sold, the
conditional profit reduces and the amount of reduction is called the incremental
(marginal) loss, IL resulting from stocking of an item that is not sold (Tersine
1975).
Additional units can therefore be stocked only when the expected incremental
profit from stocking each of them is more than the expected incremental loss from
stocking each. The expected incremental profit from stocking and selling an additional unit is the incremental profit of the unit multiplied by the probability that the
unit would be sold i.e., p(IP). The expected incremental loss from stocking and not
selling an additional unit is the incremental loss incurred if the unit remains unsold
multiplied by the probability that the unit would not be sold i.e. (1Àp)(IL). Thus the
units should be stocked up to the point where
Table 16.21 Expected profit table
Possible demand (Event)
Probability
Possible stock action (alternative)
15
16
17
18
(i)
(i) Â (2)
(i) Â (3)
(i) Â (4)
(i) Â (5)
Rs.
Rs.
Rs.
Rs.
15
0.10
45
42
39
36
16
0.20
90
96
90
84
17
0.40
180
192
204
192
18
0.30
135
144
153
162
EMV (Rs.)
450
474
486
474
16.6 Decision Making Under Conditions of Risk
463
From Table 16.21, the maximum is EMV ¼ Rs. 486 for a daily stock action of
17 ice cream cups.
16.6.5 Use of Incremental (Marginal) Analysis
In any decision making problem, the use of conditional profit and expected profit
tables could become quite cumbersome arising from the large number of calculations
required. Example 16.6, for instance, with 4 demand levels and 4 possible stock
actions involved the calculation of 16 conditional profits. For 100 values of demand
levels and stock actions, the calculations involved would be tremendous! This
excessive computational work can be avoided by using an incremental or marginal
approach. According to this approach, any additional unit purchased will either be
sold or remain unsold. Let p denote the probability of selling one additional unit,
then (1Àp) will be the probability of not selling it. If the additional unit is sold, the
conditional profit will increase as a result of the profit earned from this unit. This is
termed as incremental (marginal) profit, IP. If the additional unit is not sold, the
conditional profit reduces and the amount of reduction is called the incremental
(marginal) loss, IL resulting from stocking of an item that is not sold (Tersine
1975).
Additional units can therefore be stocked only when the expected incremental
profit from stocking each of them is more than the expected incremental loss from
stocking each. The expected incremental profit from stocking and selling an additional unit is the incremental profit of the unit multiplied by the probability that the
unit would be sold i.e., p(IP). The expected incremental loss from stocking and not
selling an additional unit is the incremental loss incurred if the unit remains unsold
multiplied by the probability that the unit would not be sold i.e. (1Àp)(IL). Thus the
units should be stocked up to the point where
Table 16.21 Expected profit table
Possible demand (Event)
Probability
Possible stock action (alternative)
15
16
17
18
(i)
(i) Â (2)
(i) Â (3)
(i) Â (4)
(i) Â (5)
Rs.
Rs.
Rs.
Rs.
15
0.10
45
42
39
36
16
0.20
90
96
90
84
17
0.40
180
192
204
192
18
0.30
135
144
153
162
EMV (Rs.)
450
474
486
474
16.6 Decision Making Under Conditions of Risk
463