

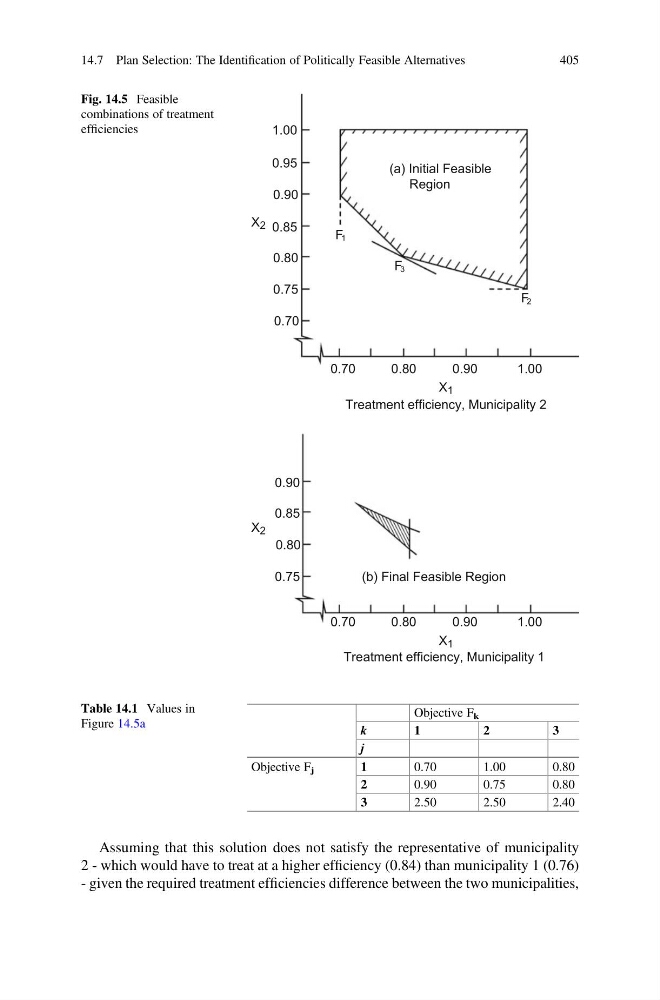
Assuming that this solution does not satisfy the representative of municipality
2 - which would have to treat at a higher efficiency (0.84) than municipality 1 (0.76)
- given the required treatment efficiencies difference between the two municipalities,
0.70
0.80
0.90
1.00
0.70
0.80
0.90
1.00
0.70
0.75
0.80
0.85
0.90
0.95
1.00
0.90
0.85
0.80
0.75
F 1
F 3
F 2
(b) Final Feasible Region
Treatment efficiency, Municipality 1
X 1
X 2
X 2
X 1
Treatment efficiency, Municipality 2
(a) Initial Feasible
Region
Fig. 14.5 Feasible
combinations of treatment
efficiencies
Table 14.1 Values in
Figure 14.5a
Objective F k
k
1
2
3
j
Objective F j
1
0.70
1.00
0.80
2
0.90
0.75
0.80
3
2.50
2.50
2.40
14.7 Plan Selection: The Identification of Politically Feasible Alternatives
405
2 - which would have to treat at a higher efficiency (0.84) than municipality 1 (0.76)
- given the required treatment efficiencies difference between the two municipalities,
0.70
0.80
0.90
1.00
0.70
0.80
0.90
1.00
0.70
0.75
0.80
0.85
0.90
0.95
1.00
0.90
0.85
0.80
0.75
F 1
F 3
F 2
(b) Final Feasible Region
Treatment efficiency, Municipality 1
X 1
X 2
X 2
X 1
Treatment efficiency, Municipality 2
(a) Initial Feasible
Region
Fig. 14.5 Feasible
combinations of treatment
efficiencies
Table 14.1 Values in
Figure 14.5a
Objective F k
k
1
2
3
j
Objective F j
1
0.70
1.00
0.80
2
0.90
0.75
0.80
3
2.50
2.50
2.40
14.7 Plan Selection: The Identification of Politically Feasible Alternatives
405