

Probably, however, instead of giving actual numbers, the relevant ratio
(e.g. number of victims divided by population, etc.) may give a better comparison
among countries. For example, a level 5 for Mount Pelée eruption (see Table 12.6)
does not indicate that there were only 3 survivors out of the 29,000 inhabitants,
i.e. practically the whole population died (Scarth 2002).
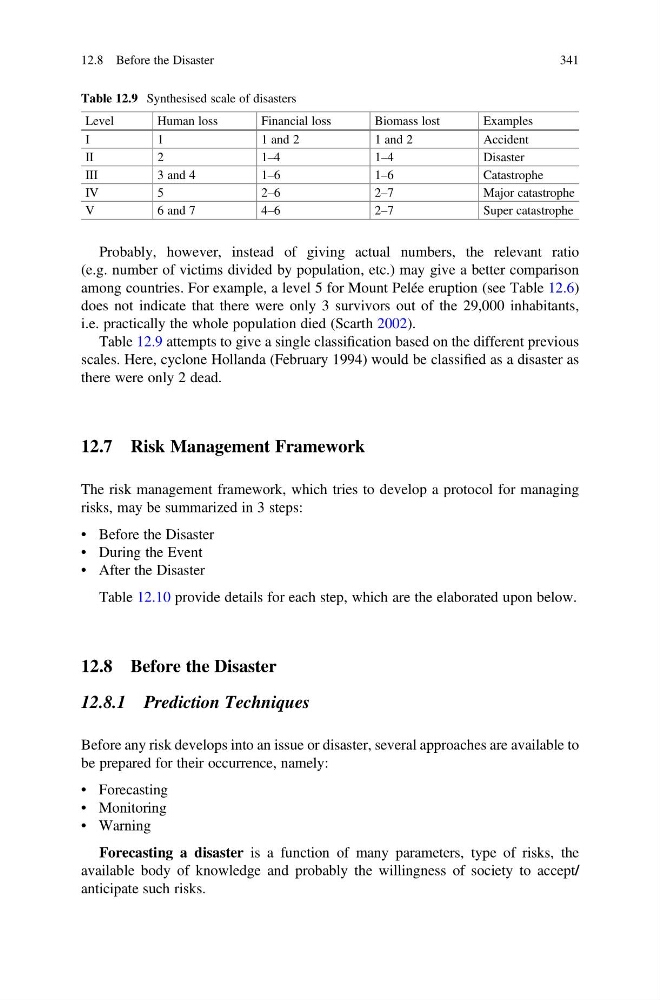
Table 12.9 attempts to give a single classification based on the different previous
scales. Here, cyclone Hollanda (February 1994) would be classified as a disaster as
there were only 2 dead.
12.7 Risk Management Framework
The risk management framework, which tries to develop a protocol for managing
risks, may be summarized in 3 steps:
• Before the Disaster
• During the Event
• After the Disaster
Table 12.10 provide details for each step, which are the elaborated upon below.
12.8 Before the Disaster
12.8.1 Prediction Techniques
Before any risk develops into an issue or disaster, several approaches are available to
be prepared for their occurrence, namely:
• Forecasting
• Monitoring
• Warning
Forecasting a disaster is a function of many parameters, type of risks, the
available body of knowledge and probably the willingness of society to accept/
anticipate such risks.
Table 12.9 Synthesised scale of disasters
Level
Human loss
Financial loss
Biomass lost
Examples
I
1
1 and 2
1 and 2
Accident
II
2
1–4
1 –4
Disaster
III
3 and 4
1–6
1 –6
Catastrophe
IV
5
2–6
2 –7
Major catastrophe
V
6 and 7
4–6
2 –7
Super catastrophe
12.8 Before the Disaster
341
(e.g. number of victims divided by population, etc.) may give a better comparison
among countries. For example, a level 5 for Mount Pelée eruption (see Table 12.6)
does not indicate that there were only 3 survivors out of the 29,000 inhabitants,
i.e. practically the whole population died (Scarth 2002).
Table 12.9 attempts to give a single classification based on the different previous
scales. Here, cyclone Hollanda (February 1994) would be classified as a disaster as
there were only 2 dead.
12.7 Risk Management Framework
The risk management framework, which tries to develop a protocol for managing
risks, may be summarized in 3 steps:
• Before the Disaster
• During the Event
• After the Disaster
Table 12.10 provide details for each step, which are the elaborated upon below.
12.8 Before the Disaster
12.8.1 Prediction Techniques
Before any risk develops into an issue or disaster, several approaches are available to
be prepared for their occurrence, namely:
• Forecasting
• Monitoring
• Warning
Forecasting a disaster is a function of many parameters, type of risks, the
available body of knowledge and probably the willingness of society to accept/
anticipate such risks.
Table 12.9 Synthesised scale of disasters
Level
Human loss
Financial loss
Biomass lost
Examples
I
1
1 and 2
1 and 2
Accident
II
2
1–4
1 –4
Disaster
III
3 and 4
1–6
1 –6
Catastrophe
IV
5
2–6
2 –7
Major catastrophe
V
6 and 7
4–6
2 –7
Super catastrophe
12.8 Before the Disaster
341