

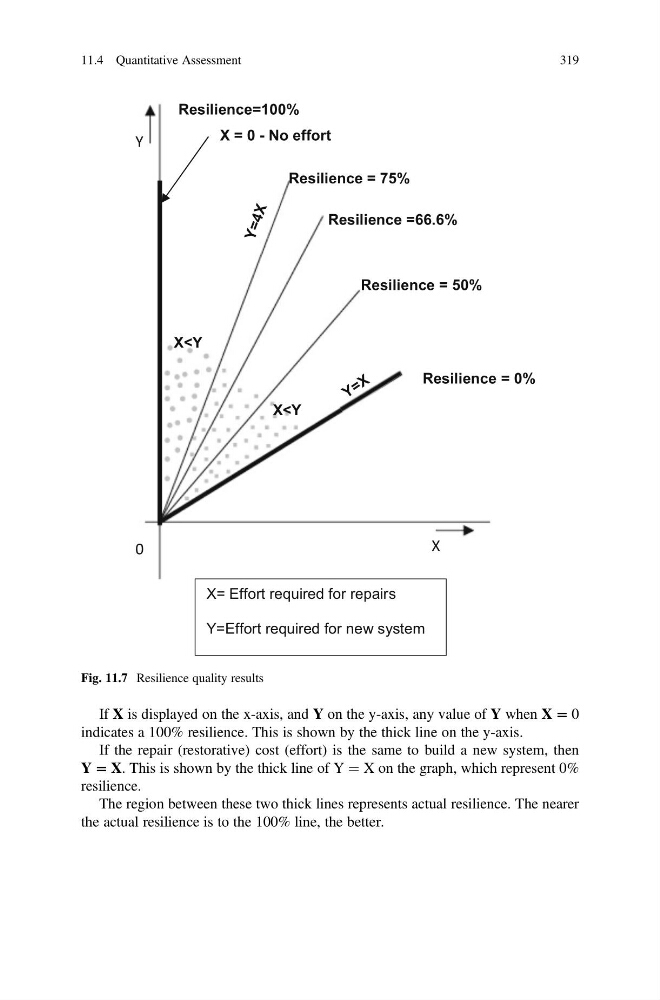
If X is displayed on the x-axis, and Y on the y-axis, any value of Y when X = 0
indicates a 100% resilience. This is shown by the thick line on the y-axis.
If the repair (restorative) cost (effort) is the same to build a new system, then
Y = X. This is shown by the thick line of Y ¼ X on the graph, which represent 0%
resilience.
The region between these two thick lines represents actual resilience. The nearer
the actual resilience is to the 100% line, the better.
Resilience = 75%
Resilience = 0%
Resilience = 50%
X
Resilience =66.6%
Y
0
X = 0 - No effort
Resilience=100%
X
Y=Effort required for new system
Fig. 11.7 Resilience quality results
11.4 Quantitative Assessment
319
indicates a 100% resilience. This is shown by the thick line on the y-axis.
If the repair (restorative) cost (effort) is the same to build a new system, then
Y = X. This is shown by the thick line of Y ¼ X on the graph, which represent 0%
resilience.
The region between these two thick lines represents actual resilience. The nearer
the actual resilience is to the 100% line, the better.
Resilience = 75%
Resilience = 0%
Resilience = 50%
X
Resilience =66.6%
Y
0
X = 0 - No effort
Resilience=100%
X
Y=Effort required for new system
Fig. 11.7 Resilience quality results
11.4 Quantitative Assessment
319