

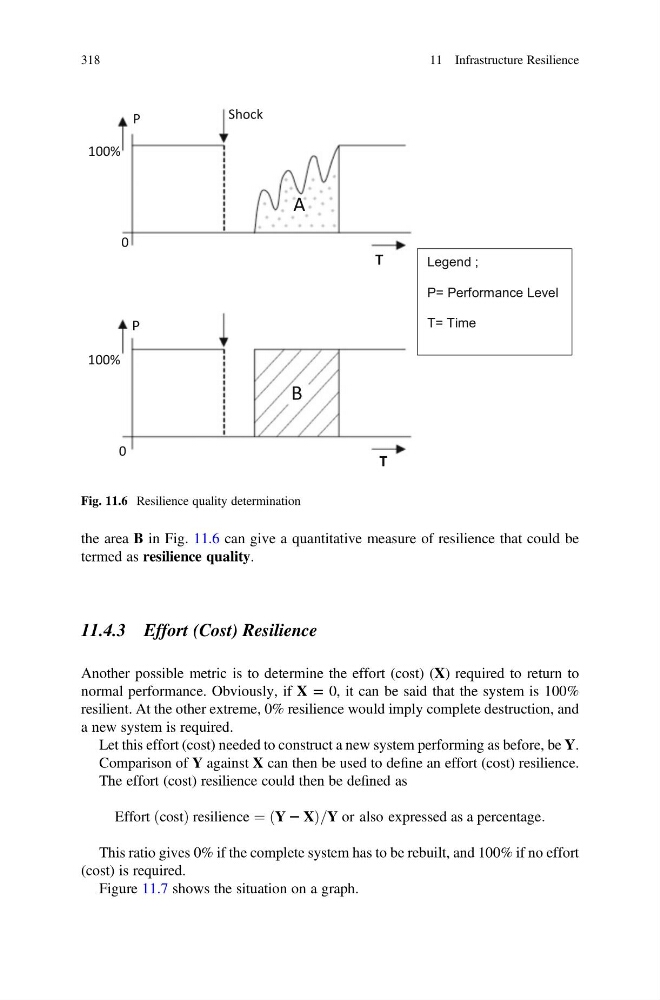
the area B in Fig. 11.6 can give a quantitative measure of resilience that could be
termed as resilience quality.
11.4.3 Effort (Cost) Resilience
Another possible metric is to determine the effort (cost) (X) required to return to
normal performance. Obviously, if X = 0, it can be said that the system is 100%
resilient. At the other extreme, 0% resilience would imply complete destruction, and
a new system is required.
Let this effort (cost) needed to construct a new system performing as before, be Y.
Comparison of Y against X can then be used to define an effort (cost) resilience.
The effort (cost) resilience could then be defined as
Effort cost
ð
Þresilience ¼ Y 2 X
ð
Þ=Y or also expressed as a percentage:
This ratio gives 0% if the complete system has to be rebuilt, and 100% if no effort
(cost) is required.
Figure 11.7 shows the situation on a graph.
P
Shock
B
A
100%
0
0
100%
T
P
T
Legend ;
P= Performance Level
T= Time
Fig. 11.6 Resilience quality determination
318
11 Infrastructure Resilience
termed as resilience quality.
11.4.3 Effort (Cost) Resilience
Another possible metric is to determine the effort (cost) (X) required to return to
normal performance. Obviously, if X = 0, it can be said that the system is 100%
resilient. At the other extreme, 0% resilience would imply complete destruction, and
a new system is required.
Let this effort (cost) needed to construct a new system performing as before, be Y.
Comparison of Y against X can then be used to define an effort (cost) resilience.
The effort (cost) resilience could then be defined as
Effort cost
ð
Þresilience ¼ Y 2 X
ð
Þ=Y or also expressed as a percentage:
This ratio gives 0% if the complete system has to be rebuilt, and 100% if no effort
(cost) is required.
Figure 11.7 shows the situation on a graph.
P
Shock
B
A
100%
0
0
100%
T
P
T
Legend ;
P= Performance Level
T= Time
Fig. 11.6 Resilience quality determination
318
11 Infrastructure Resilience