

11.4 Quantitative Assessment
11.4.1 Resilience Efficiency
As explained earlier, while output is usually a measure of performance, the time
taken to return to normal performance can also be another measure of resilience, as
well as the effort (cost, resources) required to do so.
If we define the concept of Resilience efficiency ¼
Output under or after
ð
ÞShock
Normal Output
,
it is logical to use the same principles to introduce the recovery time and the effort
required in a quantitative estimate of resilience.
11.4.2 Resilience Quality
If two similar systems are equally damaged, the time it takes for them to recover back
to normal performance can be a simple measure for resilience (cf. Figure 11.2). The
longer time it takes, the less resilient it is.
With hard resilience, the system resists completely to the shock. Practically, the
system performs as previous to the impact. Figure 11.3(a) shows this. A building
subjected to a wind gust behaves like this. During a lightning flash, the electricity
supply may momentarily be cut during a fraction of a second. However, during a
hurricane, the power supply may, on purpose, be interrupted for security reasons,
such to avoid anybody touching broken (overhead) cables, etc. This time, the
interruption is longer, but after the event, performance is back to normal. (See
Fig. 11.3(b)).
However, as Fig. 11.4(a, b, c and d) shows, the system may be only partly
functional, say at y %, y varying with time, during this recovery period. The
variation of y with time may be linear, logarithmic, exponential or even erratic
(Fig. 11.6).
If this percentage y %, is plotted on the y-axis (Figs. 11.3 and 11.4) against time,
the area under the curve gives a better metric of the product (performance x time).
Had there been no damage, the area under the curve would have been 100% x
recovery period, still showing a 100% functionality. Thus, the ratio of the area A to
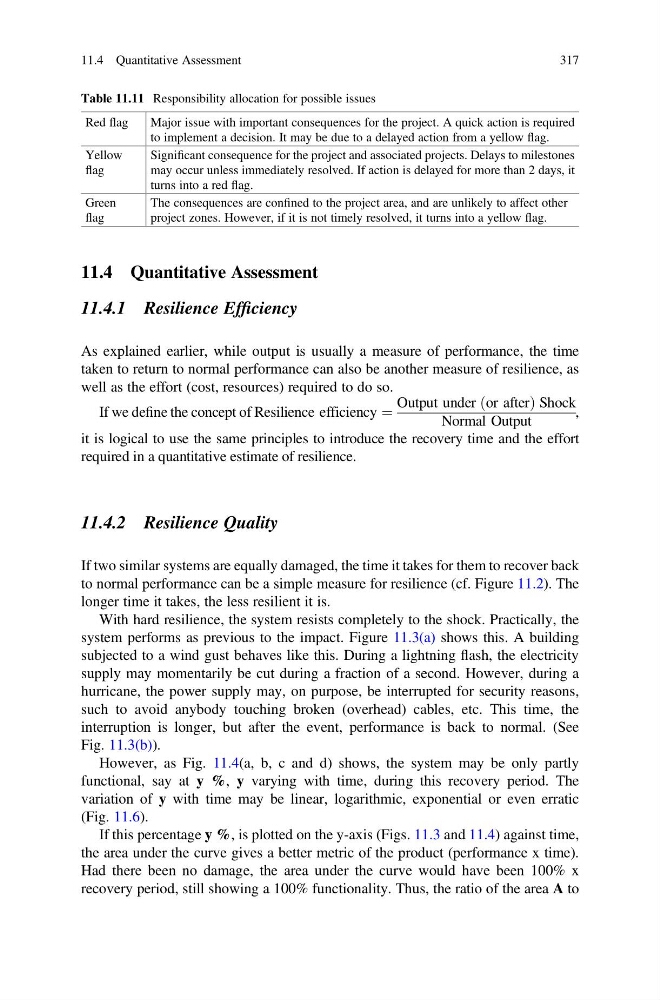
Table 11.11 Responsibility allocation for possible issues
Red flag
Major issue with important consequences for the project. A quick action is required
to implement a decision. It may be due to a delayed action from a yellow flag.
Yellow
flag
Significant consequence for the project and associated projects. Delays to milestones
may occur unless immediately resolved. If action is delayed for more than 2 days, it
turns into a red flag.
Green
flag
The consequences are confined to the project area, and are unlikely to affect other
project zones. However, if it is not timely resolved, it turns into a yellow flag.
11.4 Quantitative Assessment
317
11.4.1 Resilience Efficiency
As explained earlier, while output is usually a measure of performance, the time
taken to return to normal performance can also be another measure of resilience, as
well as the effort (cost, resources) required to do so.
If we define the concept of Resilience efficiency ¼
Output under or after
ð
ÞShock
Normal Output
,
it is logical to use the same principles to introduce the recovery time and the effort
required in a quantitative estimate of resilience.
11.4.2 Resilience Quality
If two similar systems are equally damaged, the time it takes for them to recover back
to normal performance can be a simple measure for resilience (cf. Figure 11.2). The
longer time it takes, the less resilient it is.
With hard resilience, the system resists completely to the shock. Practically, the
system performs as previous to the impact. Figure 11.3(a) shows this. A building
subjected to a wind gust behaves like this. During a lightning flash, the electricity
supply may momentarily be cut during a fraction of a second. However, during a
hurricane, the power supply may, on purpose, be interrupted for security reasons,
such to avoid anybody touching broken (overhead) cables, etc. This time, the
interruption is longer, but after the event, performance is back to normal. (See
Fig. 11.3(b)).
However, as Fig. 11.4(a, b, c and d) shows, the system may be only partly
functional, say at y %, y varying with time, during this recovery period. The
variation of y with time may be linear, logarithmic, exponential or even erratic
(Fig. 11.6).
If this percentage y %, is plotted on the y-axis (Figs. 11.3 and 11.4) against time,
the area under the curve gives a better metric of the product (performance x time).
Had there been no damage, the area under the curve would have been 100% x
recovery period, still showing a 100% functionality. Thus, the ratio of the area A to
Table 11.11 Responsibility allocation for possible issues
Red flag
Major issue with important consequences for the project. A quick action is required
to implement a decision. It may be due to a delayed action from a yellow flag.
Yellow
flag
Significant consequence for the project and associated projects. Delays to milestones
may occur unless immediately resolved. If action is delayed for more than 2 days, it
turns into a red flag.
Green
flag
The consequences are confined to the project area, and are unlikely to affect other
project zones. However, if it is not timely resolved, it turns into a yellow flag.
11.4 Quantitative Assessment
317