

11.3 Qualitative Assessment
11.3.1 Risk Analysis Approach
Usually, when implementing a project, a risk analysis is carried out prior to and
during project execution, as shown in Table 11.7. A complete brainstorming is
effected in order to identify the maximum number of possible risks to the project.
Once the risks have been compiled, the project team assesses, for each risk:
(1) the occurrence probability on a scale of 1–9 and
(2) the impact on the project if the risk does occur.
Thus, all risks are rated as per Table 11.8.
The details explaining the above impact classification of Table 11.8 are provided
in Table 11.9. These are useful in determining the dangerous zones to avoid.
11.3.2 Resilience Assessment Approach
Thus, using a similar approach, the system under scrutiny, may be assessed for its
resilience qualitatively, as detailed in Table 11.10.
Issues identified are ranked based on their impact and expected consequences by
assigning a red, yellow or green flag. These determine the duties of those responsible, as shown in Table 11.11.
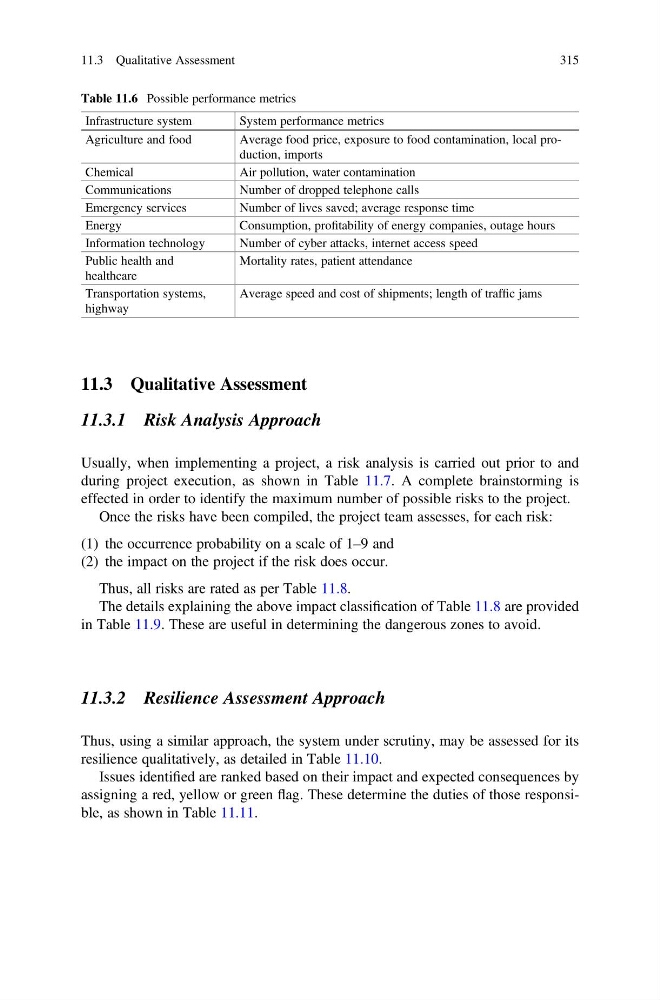
Table 11.6 Possible performance metrics
Infrastructure system
System performance metrics
Agriculture and food
Average food price, exposure to food contamination, local production, imports
Chemical
Air pollution, water contamination
Communications
Number of dropped telephone calls
Emergency services
Number of lives saved; average response time
Energy
Consumption, profitability of energy companies, outage hours
Information technology
Number of cyber attacks, internet access speed
Public health and
healthcare
Mortality rates, patient attendance
Transportation systems,
highway
Average speed and cost of shipments; length of traffic jams
11.3 Qualitative Assessment
315
11.3.1 Risk Analysis Approach
Usually, when implementing a project, a risk analysis is carried out prior to and
during project execution, as shown in Table 11.7. A complete brainstorming is
effected in order to identify the maximum number of possible risks to the project.
Once the risks have been compiled, the project team assesses, for each risk:
(1) the occurrence probability on a scale of 1–9 and
(2) the impact on the project if the risk does occur.
Thus, all risks are rated as per Table 11.8.
The details explaining the above impact classification of Table 11.8 are provided
in Table 11.9. These are useful in determining the dangerous zones to avoid.
11.3.2 Resilience Assessment Approach
Thus, using a similar approach, the system under scrutiny, may be assessed for its
resilience qualitatively, as detailed in Table 11.10.
Issues identified are ranked based on their impact and expected consequences by
assigning a red, yellow or green flag. These determine the duties of those responsible, as shown in Table 11.11.
Table 11.6 Possible performance metrics
Infrastructure system
System performance metrics
Agriculture and food
Average food price, exposure to food contamination, local production, imports
Chemical
Air pollution, water contamination
Communications
Number of dropped telephone calls
Emergency services
Number of lives saved; average response time
Energy
Consumption, profitability of energy companies, outage hours
Information technology
Number of cyber attacks, internet access speed
Public health and
healthcare
Mortality rates, patient attendance
Transportation systems,
highway
Average speed and cost of shipments; length of traffic jams
11.3 Qualitative Assessment
315