

changes in function or structure, depending on the flexibility and adaptive
capacity of the system as a whole. There is no specific strengthening measure
contrary, to the hard resilience form.
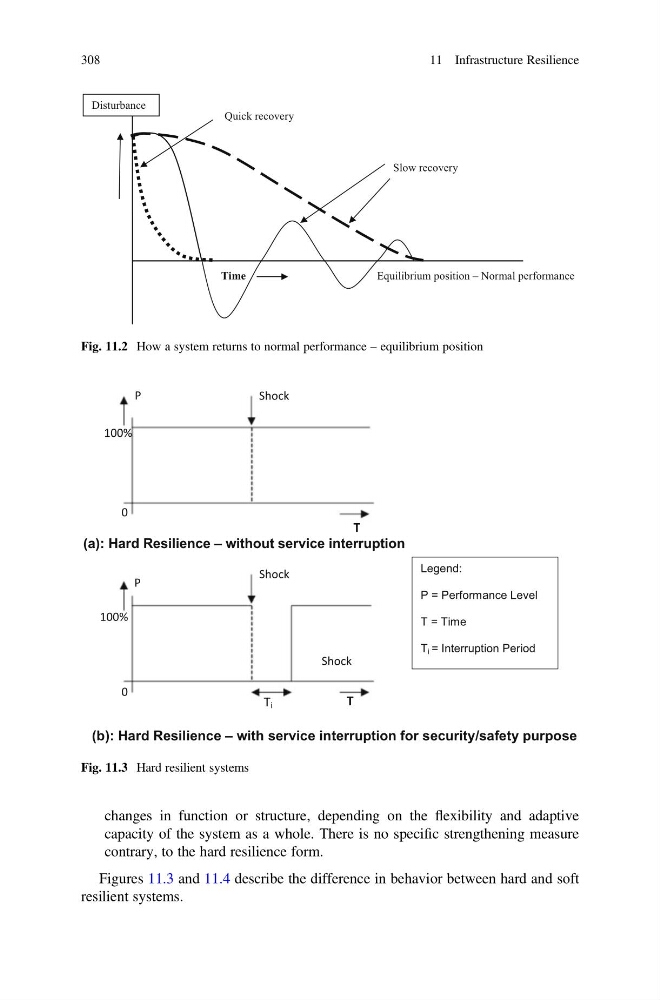
Figures 11.3 and 11.4 describe the difference in behavior between hard and soft
resilient systems.
Slow recovery
Quick recovery
Equilibrium position – Normal performance
Time
Disturbance
Fig. 11.2 How a system returns to normal performance – equilibrium position
(a): Hard Resilience – without service interruption
Shock
T
P
Shock
100%
0
(b): Hard Resilience – with service interruption for security/safety purpose
T
T i
0
100%
Legend:
P = Performance Level
T = Time
T i = Interruption Period
Shock
P
Fig. 11.3 Hard resilient systems
308
11 Infrastructure Resilience
capacity of the system as a whole. There is no specific strengthening measure
contrary, to the hard resilience form.
Figures 11.3 and 11.4 describe the difference in behavior between hard and soft
resilient systems.
Slow recovery
Quick recovery
Equilibrium position – Normal performance
Time
Disturbance
Fig. 11.2 How a system returns to normal performance – equilibrium position
(a): Hard Resilience – without service interruption
Shock
T
P
Shock
100%
0
(b): Hard Resilience – with service interruption for security/safety purpose
T
T i
0
100%
Legend:
P = Performance Level
T = Time
T i = Interruption Period
Shock
P
Fig. 11.3 Hard resilient systems
308
11 Infrastructure Resilience