

10 Module Deployment and Energy Rating
279
(a)
(b)
(c)
(d)
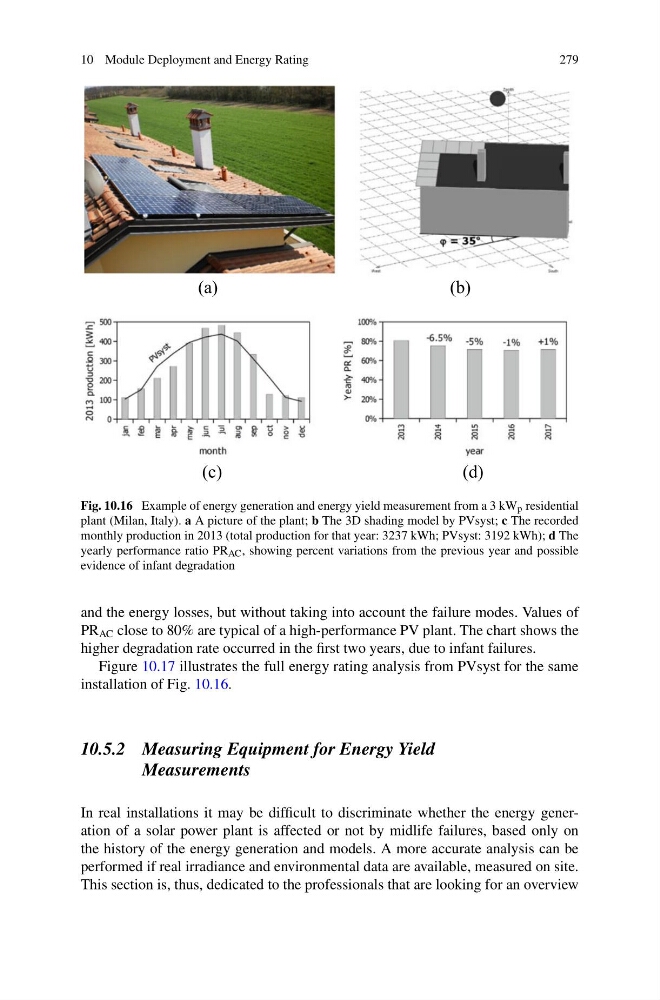
Fig. 10.16 Example of energy generation and energy yield measurement from a 3 kW p residential
plant (Milan, Italy). a A picture of the plant; b The 3D shading model by PVsyst; c The recorded
monthly production in 2013 (total production for that year: 3237 kWh; PVsyst: 3192 kWh); d The
yearly performance ratio PR AC , showing percent variations from the previous year and possible
evidence of infant degradation
and the energy losses, but without taking into account the failure modes. Values of
PR AC close to 80% are typical of a high-performance PV plant. The chart shows the
higher degradation rate occurred in the first two years, due to infant failures.
Figure 10.17 illustrates the full energy rating analysis from PVsyst for the same
installation of Fig. 10.16.
10.5.2 Measuring Equipment for Energy Yield
Measurements
In real installations it may be difficult to discriminate whether the energy generation of a solar power plant is affected or not by midlife failures, based only on
the history of the energy generation and models. A more accurate analysis can be
performed if real irradiance and environmental data are available, measured on site.
This section is, thus, dedicated to the professionals that are looking for an overview
279
(a)
(b)
(c)
(d)
Fig. 10.16 Example of energy generation and energy yield measurement from a 3 kW p residential
plant (Milan, Italy). a A picture of the plant; b The 3D shading model by PVsyst; c The recorded
monthly production in 2013 (total production for that year: 3237 kWh; PVsyst: 3192 kWh); d The
yearly performance ratio PR AC , showing percent variations from the previous year and possible
evidence of infant degradation
and the energy losses, but without taking into account the failure modes. Values of
PR AC close to 80% are typical of a high-performance PV plant. The chart shows the
higher degradation rate occurred in the first two years, due to infant failures.
Figure 10.17 illustrates the full energy rating analysis from PVsyst for the same
installation of Fig. 10.16.
10.5.2 Measuring Equipment for Energy Yield
Measurements
In real installations it may be difficult to discriminate whether the energy generation of a solar power plant is affected or not by midlife failures, based only on
the history of the energy generation and models. A more accurate analysis can be
performed if real irradiance and environmental data are available, measured on site.
This section is, thus, dedicated to the professionals that are looking for an overview