

278
M. Pravettoni
includes also all the needed parameters for energy rating: global horizontal and inplane irradiance at time t, direct horizontal and direct in-plane irradiance at time t,
ambient temperature, wind speed, Sun elevation, angle of incidence, and global inplane spectral irradiance. (All data refer to a fixed installation at β = 20
◦ tilt facing
the equator).
For a more accurate analysis one may need data for a different geometry (i.e.
different tilt and orientation) or for a particular geographical position that does not
necessary match one of the six climatic profiles listed in IEC 60853-4. The open
source tool PVGIS (see [12]) by the Joint Research Centre of the European Commission is a source of such information and provides additional features also for
tracking systems and off-grid installations. The software requires some basic information on the precise geographical coordinates, geometry of installation, PV module
technology, nominal power installed and system energy losses from module to the
grid (discussed in Sect. 10.4.1: PVGIS default is 14%, but can be modified by the
user). As a result, it gives the yearly PV energy production and its standard deviation
(in kWh), and the yearly in-plane irradiation (in kWh/m
2 ). PVLIB (developed by
Sandia National Laboratory, USA) and SAM (by NREL, USA) are other examples
of free energy rating tools that are available online for download.
Other commercial tools are on the market, providing a variety of energy output.
The best-known at time of writing is PVsyst (see [13]). PVsyst allows to input the 3D
shading scene of the installation, thus highlighting the possible shading losses from
nearby obstacles. The energy rating of PVsyst allows to calculate the distribution
of energy throughout the year based on input data and Meteonorm
18 , and gives
as a result the total energy production (in kWh/y and in kWh produced per kW p
installed). It also shows the main energy losses involved in the simulation and other
useful performance metrics.
Figure 10.16 shows a real case scenario, with simulation from PVsyst, for a
3.0 kW p residential installation in the metropolitan area of Milan, Italy (tilt: 20°;
azimuth: 35°; 9 Sunpower E20/327 modules; STC power: 327 W; module efficiency:
20.1%, connected to the grid in May 2012). Figure 10.16c illustrates the recorded
monthly energy injected into the grid in 2013, compared with the PVsyst predicted
monthly energy yield for the first year of installation. Figure 10.16d shows the yearly
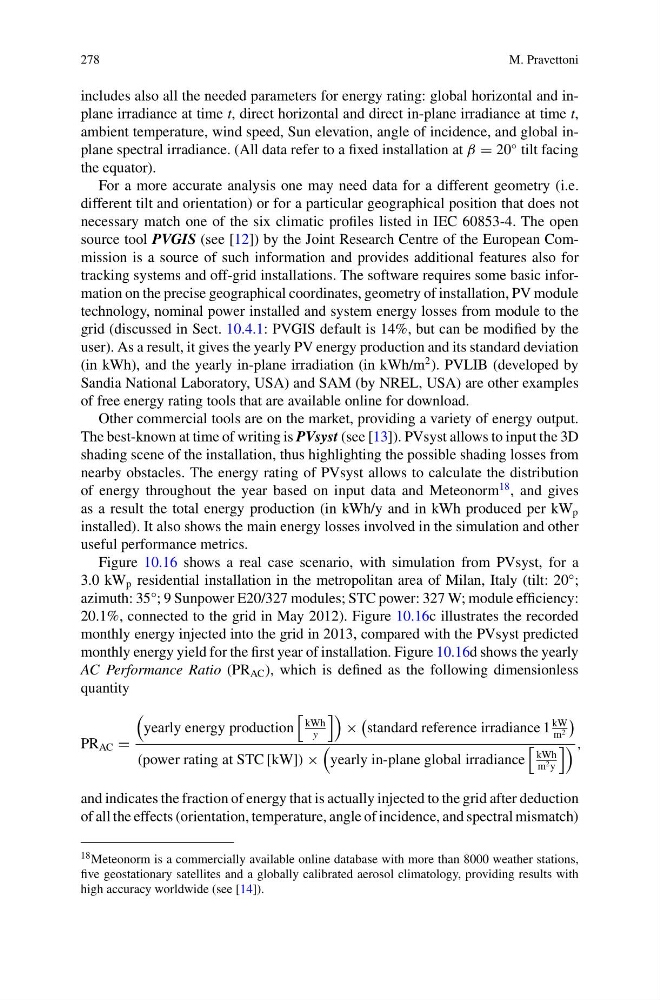
AC Performance Ratio (PR AC ), which is defined as the following dimensionless
quantity
PR AC =
yearly energy production
kWh
y
×
standard reference irradiance 1
kW
m 2
(power rating at STC [kW]) ×
yearly in-plane global irradiance
kWh
m 2 y
,
and indicates the fraction of energy that is actually injected to the grid after deduction
of all the effects (orientation, temperature, angle of incidence, and spectral mismatch)
18 Meteonorm is a commercially available online database with more than 8000 weather stations,
five geostationary satellites and a globally calibrated aerosol climatology, providing results with
high accuracy worldwide (see [14]).
M. Pravettoni
includes also all the needed parameters for energy rating: global horizontal and inplane irradiance at time t, direct horizontal and direct in-plane irradiance at time t,
ambient temperature, wind speed, Sun elevation, angle of incidence, and global inplane spectral irradiance. (All data refer to a fixed installation at β = 20
◦ tilt facing
the equator).
For a more accurate analysis one may need data for a different geometry (i.e.
different tilt and orientation) or for a particular geographical position that does not
necessary match one of the six climatic profiles listed in IEC 60853-4. The open
source tool PVGIS (see [12]) by the Joint Research Centre of the European Commission is a source of such information and provides additional features also for
tracking systems and off-grid installations. The software requires some basic information on the precise geographical coordinates, geometry of installation, PV module
technology, nominal power installed and system energy losses from module to the
grid (discussed in Sect. 10.4.1: PVGIS default is 14%, but can be modified by the
user). As a result, it gives the yearly PV energy production and its standard deviation
(in kWh), and the yearly in-plane irradiation (in kWh/m
2 ). PVLIB (developed by
Sandia National Laboratory, USA) and SAM (by NREL, USA) are other examples
of free energy rating tools that are available online for download.
Other commercial tools are on the market, providing a variety of energy output.
The best-known at time of writing is PVsyst (see [13]). PVsyst allows to input the 3D
shading scene of the installation, thus highlighting the possible shading losses from
nearby obstacles. The energy rating of PVsyst allows to calculate the distribution
of energy throughout the year based on input data and Meteonorm
18 , and gives
as a result the total energy production (in kWh/y and in kWh produced per kW p
installed). It also shows the main energy losses involved in the simulation and other
useful performance metrics.
Figure 10.16 shows a real case scenario, with simulation from PVsyst, for a
3.0 kW p residential installation in the metropolitan area of Milan, Italy (tilt: 20°;
azimuth: 35°; 9 Sunpower E20/327 modules; STC power: 327 W; module efficiency:
20.1%, connected to the grid in May 2012). Figure 10.16c illustrates the recorded
monthly energy injected into the grid in 2013, compared with the PVsyst predicted
monthly energy yield for the first year of installation. Figure 10.16d shows the yearly
AC Performance Ratio (PR AC ), which is defined as the following dimensionless
quantity
PR AC =
yearly energy production
kWh
y
×
standard reference irradiance 1
kW
m 2
(power rating at STC [kW]) ×
yearly in-plane global irradiance
kWh
m 2 y
,
and indicates the fraction of energy that is actually injected to the grid after deduction
of all the effects (orientation, temperature, angle of incidence, and spectral mismatch)
18 Meteonorm is a commercially available online database with more than 8000 weather stations,
five geostationary satellites and a globally calibrated aerosol climatology, providing results with
high accuracy worldwide (see [14]).