

118
S. Leu and D. Sontag
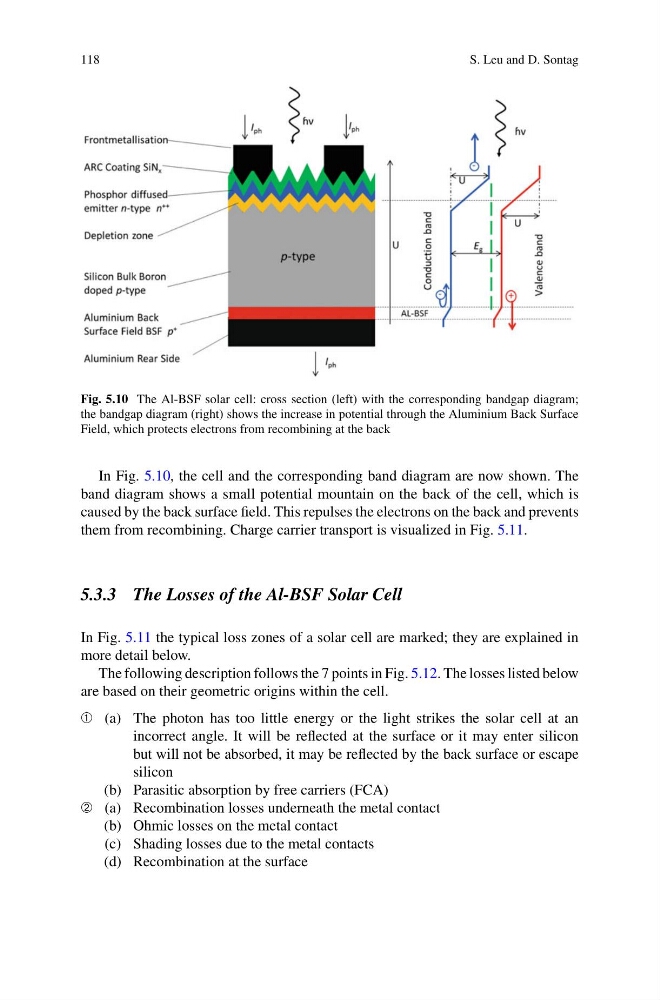
Fig. 5.10 The Al-BSF solar cell: cross section (left) with the corresponding bandgap diagram;
the bandgap diagram (right) shows the increase in potential through the Aluminium Back Surface
Field, which protects electrons from recombining at the back
In Fig. 5.10, the cell and the corresponding band diagram are now shown. The
band diagram shows a small potential mountain on the back of the cell, which is
caused by the back surface field. This repulses the electrons on the back and prevents
them from recombining. Charge carrier transport is visualized in Fig. 5.11.
5.3.3 The Losses of the Al-BSF Solar Cell
In Fig. 5.11 the typical loss zones of a solar cell are marked; they are explained in
more detail below.
The following description follows the 7 points in Fig. 5.12. The losses listed below
are based on their geometric origins within the cell.
➀ (a) The photon has too little energy or the light strikes the solar cell at an
incorrect angle. It will be reflected at the surface or it may enter silicon
but will not be absorbed, it may be reflected by the back surface or escape
silicon
(b) Parasitic absorption by free carriers (FCA)
➁ (a) Recombination losses underneath the metal contact
(b) Ohmic losses on the metal contact
(c) Shading losses due to the metal contacts
(d) Recombination at the surface
S. Leu and D. Sontag
Fig. 5.10 The Al-BSF solar cell: cross section (left) with the corresponding bandgap diagram;
the bandgap diagram (right) shows the increase in potential through the Aluminium Back Surface
Field, which protects electrons from recombining at the back
In Fig. 5.10, the cell and the corresponding band diagram are now shown. The
band diagram shows a small potential mountain on the back of the cell, which is
caused by the back surface field. This repulses the electrons on the back and prevents
them from recombining. Charge carrier transport is visualized in Fig. 5.11.
5.3.3 The Losses of the Al-BSF Solar Cell
In Fig. 5.11 the typical loss zones of a solar cell are marked; they are explained in
more detail below.
The following description follows the 7 points in Fig. 5.12. The losses listed below
are based on their geometric origins within the cell.
➀ (a) The photon has too little energy or the light strikes the solar cell at an
incorrect angle. It will be reflected at the surface or it may enter silicon
but will not be absorbed, it may be reflected by the back surface or escape
silicon
(b) Parasitic absorption by free carriers (FCA)
➁ (a) Recombination losses underneath the metal contact
(b) Ohmic losses on the metal contact
(c) Shading losses due to the metal contacts
(d) Recombination at the surface