

interference result of two optical harmonics, which are applied to the PD area:
E 10L t
ð Þ ¼
ffiffiffiffiffi
A 1
p
E 0L cos 2πν 0L t þ φ 0L þ φ 10Lm t
ð Þ
½
and
E 20L t
ð Þ ¼
ffiffiffiffiffi
A 2
p
E 0L cos 2π ν 0L þ f 0
ð
Þ t þ φ 0L þ φ 20Lm t
ð Þ
½
with the amplitudes
ffiffiffiffiffi
A 1
p
E 0L and
ffiffiffiffiffi
A 2
p
E 0L . As the result of the statistical averaging, the laser fluctuations in the PD
photocurrent (in the PD load or in the correlator output) are suppressed. At open
feedback loop, the difference of delay times in optical channels differs by ΔT M . At
open feedback loop, the effectiveness of suppression is determined by the ratio
2ΔT M /T c .
At closed feedback loop (Fig. 5.10) or in the autonomous OEO oscillator, in the
statistical process of the phase fluctuation suppression, the delay time difference in
optical channels is ΔT M + T FOS . At closed feedback loop, the suppression effectiveness is determined by the ratio 2(ΔT M + T FOS )/T c .
random quantity h
s
2
x = 2
s
2
x = 2
0.02
0.02
10 -4
10 -8
10 -12
10 -16
0.001
-0.010
-0.005
0.005
0.010
10 -5
10 -7
10 -9
10 -11
0.10
0.05 0.10
0.50 1
5
1
0.2
0.2
random quantity h
(a)
(b)
probability distribution
p
02 (h)
probability distribution
p
02 (h)
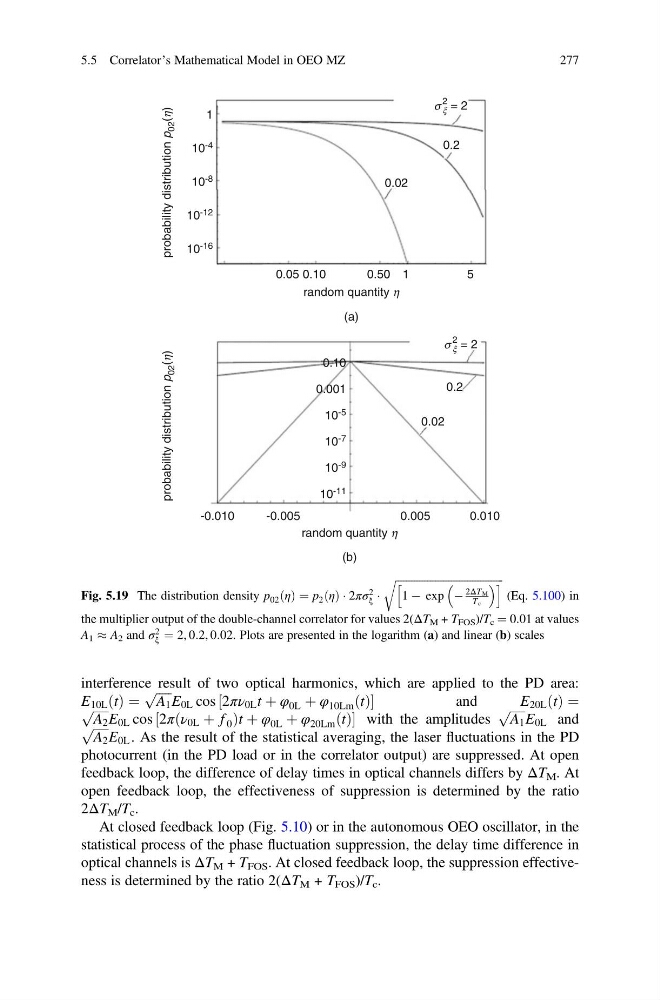
Fig. 5.19 The distribution density p 02 η
ð Þ ¼ p 2 η
ð Þ Á 2πσ
2
ξ Á
ffiffiffiffiffiffiffiffiffiffiffiffiffiffiffiffiffiffiffiffiffiffiffiffiffiffiffiffiffiffiffiffiffiffiffiffiffiffiffiffi ffi
1 À exp À
2ΔTM
Tc
h
i
r
(Eq. 5.100) in
the multiplier output of the double-channel correlator for values 2(ΔT M + T FOS )/T c ¼ 0.01 at values
A 1 % A 2 and σ
2
ξ ¼ 2, 0:2, 0:02. Plots are presented in the logarithm (a) and linear (b) scales
5.5 Correlator’s Mathematical Model in OEO MZ
277
E 10L t
ð Þ ¼
ffiffiffiffiffi
A 1
p
E 0L cos 2πν 0L t þ φ 0L þ φ 10Lm t
ð Þ
½
and
E 20L t
ð Þ ¼
ffiffiffiffiffi
A 2
p
E 0L cos 2π ν 0L þ f 0
ð
Þ t þ φ 0L þ φ 20Lm t
ð Þ
½
with the amplitudes
ffiffiffiffiffi
A 1
p
E 0L and
ffiffiffiffiffi
A 2
p
E 0L . As the result of the statistical averaging, the laser fluctuations in the PD
photocurrent (in the PD load or in the correlator output) are suppressed. At open
feedback loop, the difference of delay times in optical channels differs by ΔT M . At
open feedback loop, the effectiveness of suppression is determined by the ratio
2ΔT M /T c .
At closed feedback loop (Fig. 5.10) or in the autonomous OEO oscillator, in the
statistical process of the phase fluctuation suppression, the delay time difference in
optical channels is ΔT M + T FOS . At closed feedback loop, the suppression effectiveness is determined by the ratio 2(ΔT M + T FOS )/T c .
random quantity h
s
2
x = 2
s
2
x = 2
0.02
0.02
10 -4
10 -8
10 -12
10 -16
0.001
-0.010
-0.005
0.005
0.010
10 -5
10 -7
10 -9
10 -11
0.10
0.05 0.10
0.50 1
5
1
0.2
0.2
random quantity h
(a)
(b)
probability distribution
p
02 (h)
probability distribution
p
02 (h)
Fig. 5.19 The distribution density p 02 η
ð Þ ¼ p 2 η
ð Þ Á 2πσ
2
ξ Á
ffiffiffiffiffiffiffiffiffiffiffiffiffiffiffiffiffiffiffiffiffiffiffiffiffiffiffiffiffiffiffiffiffiffiffiffiffiffiffiffi ffi
1 À exp À
2ΔTM
Tc
h
i
r
(Eq. 5.100) in
the multiplier output of the double-channel correlator for values 2(ΔT M + T FOS )/T c ¼ 0.01 at values
A 1 % A 2 and σ
2
ξ ¼ 2, 0:2, 0:02. Plots are presented in the logarithm (a) and linear (b) scales
5.5 Correlator’s Mathematical Model in OEO MZ
277