

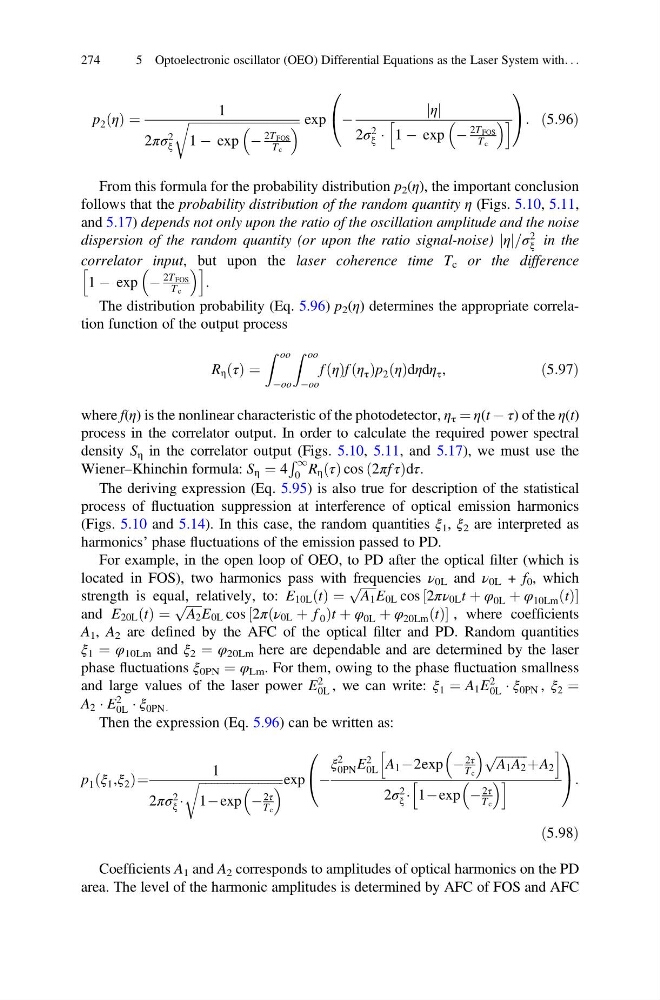
p 2 η
ð Þ ¼
1
2πσ 2
ξ
ffiffiffiffiffiffiffiffiffiffiffiffiffiffiffiffiffiffiffiffiffiffiffiffiffiffiffiffiffiffiffiffiffiffiffi ffi
1 À exp À
2T FOS
T c
r
exp À
η
j j
2σ 2
ξ Á 1 À exp À
2T FOS
T c
h
i
0
@
1
A : ð5:96Þ
From this formula for the probability distribution p 2 (η), the important conclusion
follows that the probability distribution of the random quantity η (Figs. 5.10, 5.11,
and 5.17) depends not only upon the ratio of the oscillation amplitude and the noise
dispersion of the random quantity (or upon the ratio signal-noise) η
j j=σ
2
ξ in the
correlator input, but upon the laser coherence time T c or the difference
1 À exp À
2T FOS
T c
h
i
.
The distribution probability (Eq. 5.96) p 2 (η) determines the appropriate correlation function of the output process
R η τ
ð Þ ¼
Z oo
Àoo
Z oo
Àoo
f η
ð Þf η τ
ð Þp 2 η
ð Þdηdη τ ,
ð5:97Þ
where f(η) is the nonlinear characteristic of the photodetector, η τ ¼ η(t À τ) of the η(t)
process in the correlator output. In order to calculate the required power spectral
density S η in the correlator output (Figs. 5.10, 5.11, and 5.17), we must use the
Wiener–Khinchin formula: S η ¼ 4
R 1
0 R η τ
ð Þ cos 2πf τ
ð
Þdτ.
The deriving expression (Eq. 5.95) is also true for description of the statistical
process of fluctuation suppression at interference of optical emission harmonics
(Figs. 5.10 and 5.14). In this case, the random quantities ξ 1 , ξ 2 are interpreted as
harmonics’ phase fluctuations of the emission passed to PD.
For example, in the open loop of OEO, to PD after the optical filter (which is
located in FOS), two harmonics pass with frequencies ν 0L and ν 0L + f 0 , which
strength is equal, relatively, to: E 10L t
ð Þ ¼
ffiffiffiffiffi
A 1
p
E 0L cos 2πν 0L t þ φ 0L þ φ 10Lm t
ð Þ
½
and E 20L t
ð Þ ¼
ffiffiffiffiffi
A 2
p
E 0L cos 2π ν 0L þ f 0
ð
Þ t þ φ 0L þ φ 20Lm t
ð Þ
½
, where coefficients
A 1 , A 2 are defined by the AFC of the optical filter and PD. Random quantities
ξ 1 ¼ φ 10Lm and ξ 2 ¼ φ 20Lm here are dependable and are determined by the laser
phase fluctuations ξ 0PN ¼ φ Lm . For them, owing to the phase fluctuation smallness
and large values of the laser power E
2
0L , we can write: ξ 1 ¼ A 1 E
2
0L Á ξ 0PN , ξ 2 ¼
A 2 Á E
2
0L Á ξ 0PN.
Then the expression (Eq. 5.96) can be written as:
p 1 ξ 1 ,ξ 2
ð
Þ¼
1
2πσ 2
ξ Á
ffiffiffiffiffiffiffiffiffiffiffiffiffiffiffiffiffiffiffiffiffiffiffiffiffiffiffi
1Àexp À
2τ
T c
r
exp À
ξ
2
0PN E
2
0L A 1 À2exp À
2τ
T c
ffiffiffiffiffiffiffiffiffiffi
A 1 A 2
p
þA 2
h
i
2σ 2
ξ Á 1Àexp À
2τ
T c
h
i
0
@
1
A :
ð5:98Þ
Coefficients A 1 and A 2 corresponds to amplitudes of optical harmonics on the PD
area. The level of the harmonic amplitudes is determined by AFC of FOS and AFC
274
5 Optoelectronic oscillator (OEO) Differential Equations as the Laser System with. . .
ð Þ ¼
1
2πσ 2
ξ
ffiffiffiffiffiffiffiffiffiffiffiffiffiffiffiffiffiffiffiffiffiffiffiffiffiffiffiffiffiffiffiffiffiffiffi ffi
1 À exp À
2T FOS
T c
r
exp À
η
j j
2σ 2
ξ Á 1 À exp À
2T FOS
T c
h
i
0
@
1
A : ð5:96Þ
From this formula for the probability distribution p 2 (η), the important conclusion
follows that the probability distribution of the random quantity η (Figs. 5.10, 5.11,
and 5.17) depends not only upon the ratio of the oscillation amplitude and the noise
dispersion of the random quantity (or upon the ratio signal-noise) η
j j=σ
2
ξ in the
correlator input, but upon the laser coherence time T c or the difference
1 À exp À
2T FOS
T c
h
i
.
The distribution probability (Eq. 5.96) p 2 (η) determines the appropriate correlation function of the output process
R η τ
ð Þ ¼
Z oo
Àoo
Z oo
Àoo
f η
ð Þf η τ
ð Þp 2 η
ð Þdηdη τ ,
ð5:97Þ
where f(η) is the nonlinear characteristic of the photodetector, η τ ¼ η(t À τ) of the η(t)
process in the correlator output. In order to calculate the required power spectral
density S η in the correlator output (Figs. 5.10, 5.11, and 5.17), we must use the
Wiener–Khinchin formula: S η ¼ 4
R 1
0 R η τ
ð Þ cos 2πf τ
ð
Þdτ.
The deriving expression (Eq. 5.95) is also true for description of the statistical
process of fluctuation suppression at interference of optical emission harmonics
(Figs. 5.10 and 5.14). In this case, the random quantities ξ 1 , ξ 2 are interpreted as
harmonics’ phase fluctuations of the emission passed to PD.
For example, in the open loop of OEO, to PD after the optical filter (which is
located in FOS), two harmonics pass with frequencies ν 0L and ν 0L + f 0 , which
strength is equal, relatively, to: E 10L t
ð Þ ¼
ffiffiffiffiffi
A 1
p
E 0L cos 2πν 0L t þ φ 0L þ φ 10Lm t
ð Þ
½
and E 20L t
ð Þ ¼
ffiffiffiffiffi
A 2
p
E 0L cos 2π ν 0L þ f 0
ð
Þ t þ φ 0L þ φ 20Lm t
ð Þ
½
, where coefficients
A 1 , A 2 are defined by the AFC of the optical filter and PD. Random quantities
ξ 1 ¼ φ 10Lm and ξ 2 ¼ φ 20Lm here are dependable and are determined by the laser
phase fluctuations ξ 0PN ¼ φ Lm . For them, owing to the phase fluctuation smallness
and large values of the laser power E
2
0L , we can write: ξ 1 ¼ A 1 E
2
0L Á ξ 0PN , ξ 2 ¼
A 2 Á E
2
0L Á ξ 0PN.
Then the expression (Eq. 5.96) can be written as:
p 1 ξ 1 ,ξ 2
ð
Þ¼
1
2πσ 2
ξ Á
ffiffiffiffiffiffiffiffiffiffiffiffiffiffiffiffiffiffiffiffiffiffiffiffiffiffiffi
1Àexp À
2τ
T c
r
exp À
ξ
2
0PN E
2
0L A 1 À2exp À
2τ
T c
ffiffiffiffiffiffiffiffiffiffi
A 1 A 2
p
þA 2
h
i
2σ 2
ξ Á 1Àexp À
2τ
T c
h
i
0
@
1
A :
ð5:98Þ
Coefficients A 1 and A 2 corresponds to amplitudes of optical harmonics on the PD
area. The level of the harmonic amplitudes is determined by AFC of FOS and AFC
274
5 Optoelectronic oscillator (OEO) Differential Equations as the Laser System with. . .