

different cases, for example, for T FOS /T c ( 1 and T FOS /T c > 1. It is clear that at ΔT M /
T c ( 1, ΔT MZ ¼ ΔT M , and (at small ratio of the delay time in the optical fiber to the
coherence line in the laser) T FOS /T c ( 1, we may expect the interaction of the
completely correlated quantities in the multiplier. At T FOS /T c > 1 (and if this ratio is
much more than 1), we can speak that the “correlation” process occurs of two
mutually independent quantities, although random quantities are formed by the
single noise source—the laser.
In the next section, we reduce the task of the correlator for two random quantities
ξ 1 (t) and ξ 2 (t) in OEO MZ to the task of double-dimension distribution density
finding of the probability of the Gaussian random process.
5.5.9 The Power Spectral Density S η in the Correlator Output
in OEO
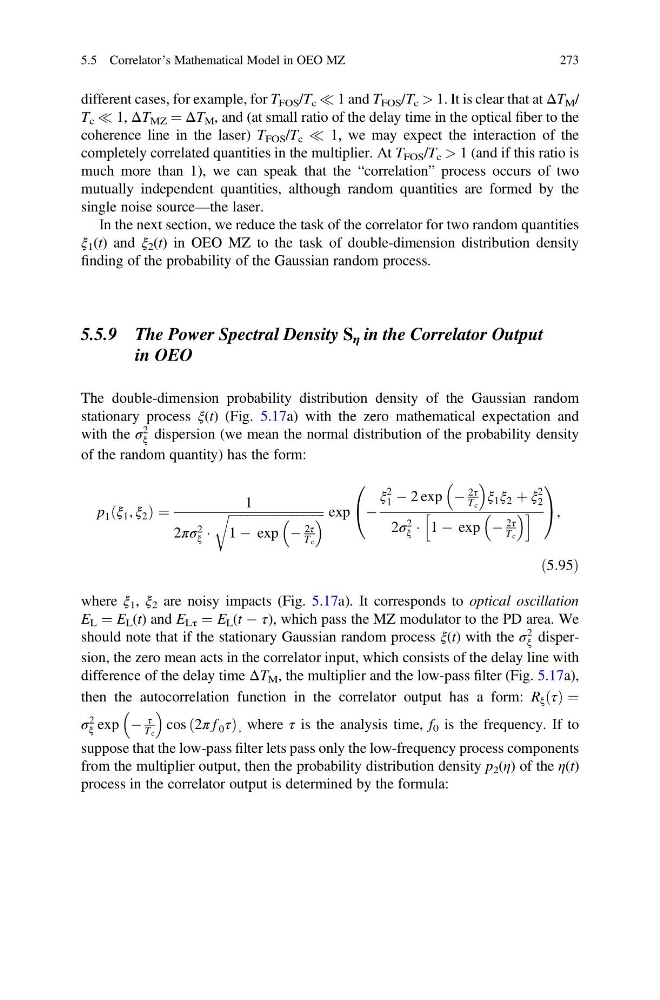
The double-dimension probability distribution density of the Gaussian random
stationary process ξ(t) (Fig. 5.17a) with the zero mathematical expectation and
with the σ
2
ξ dispersion (we mean the normal distribution of the probability density
of the random quantity) has the form:
p 1 ξ 1 , ξ 2
ð
Þ¼
1
2πσ 2
ξ Á
ffiffiffiffiffiffiffiffiffiffiffiffiffiffiffiffiffiffiffiffiffiffiffiffiffiffiffiffiffiffi ffi
1 À exp À
2τ
T c
r
exp À
ξ
2
1 À 2 exp À
2τ
T c
ξ 1 ξ 2 þ ξ
2
2
2σ 2
ξ Á 1 À exp À
2τ
T c
h
i
0
@
1
A ,
ð5:95Þ
where ξ 1 , ξ 2 are noisy impacts (Fig. 5.17a). It corresponds to optical oscillation
E L ¼ E L (t) and E Lτ ¼ E L (t À τ), which pass the MZ modulator to the PD area. We
should note that if the stationary Gaussian random process ξ(t) with the σ
2
ξ dispersion, the zero mean acts in the correlator input, which consists of the delay line with
difference of the delay time ΔT M , the multiplier and the low-pass filter (Fig. 5.17a),
then the autocorrelation function in the correlator output has a form: R ξ τ
ð Þ ¼
σ
2
ξ exp À
τ
T c
cos 2π f 0 τ
ð
Þ , where τ is the analysis time, f 0 is the frequency. If to
suppose that the low-pass filter lets pass only the low-frequency process components
from the multiplier output, then the probability distribution density p 2 (η) of the η(t)
process in the correlator output is determined by the formula:
5.5 Correlator’s Mathematical Model in OEO MZ
273
T c ( 1, ΔT MZ ¼ ΔT M , and (at small ratio of the delay time in the optical fiber to the
coherence line in the laser) T FOS /T c ( 1, we may expect the interaction of the
completely correlated quantities in the multiplier. At T FOS /T c > 1 (and if this ratio is
much more than 1), we can speak that the “correlation” process occurs of two
mutually independent quantities, although random quantities are formed by the
single noise source—the laser.
In the next section, we reduce the task of the correlator for two random quantities
ξ 1 (t) and ξ 2 (t) in OEO MZ to the task of double-dimension distribution density
finding of the probability of the Gaussian random process.
5.5.9 The Power Spectral Density S η in the Correlator Output
in OEO
The double-dimension probability distribution density of the Gaussian random
stationary process ξ(t) (Fig. 5.17a) with the zero mathematical expectation and
with the σ
2
ξ dispersion (we mean the normal distribution of the probability density
of the random quantity) has the form:
p 1 ξ 1 , ξ 2
ð
Þ¼
1
2πσ 2
ξ Á
ffiffiffiffiffiffiffiffiffiffiffiffiffiffiffiffiffiffiffiffiffiffiffiffiffiffiffiffiffiffi ffi
1 À exp À
2τ
T c
r
exp À
ξ
2
1 À 2 exp À
2τ
T c
ξ 1 ξ 2 þ ξ
2
2
2σ 2
ξ Á 1 À exp À
2τ
T c
h
i
0
@
1
A ,
ð5:95Þ
where ξ 1 , ξ 2 are noisy impacts (Fig. 5.17a). It corresponds to optical oscillation
E L ¼ E L (t) and E Lτ ¼ E L (t À τ), which pass the MZ modulator to the PD area. We
should note that if the stationary Gaussian random process ξ(t) with the σ
2
ξ dispersion, the zero mean acts in the correlator input, which consists of the delay line with
difference of the delay time ΔT M , the multiplier and the low-pass filter (Fig. 5.17a),
then the autocorrelation function in the correlator output has a form: R ξ τ
ð Þ ¼
σ
2
ξ exp À
τ
T c
cos 2π f 0 τ
ð
Þ , where τ is the analysis time, f 0 is the frequency. If to
suppose that the low-pass filter lets pass only the low-frequency process components
from the multiplier output, then the probability distribution density p 2 (η) of the η(t)
process in the correlator output is determined by the formula:
5.5 Correlator’s Mathematical Model in OEO MZ
273