

478
10 The Statistical Basis of Bioenergetics
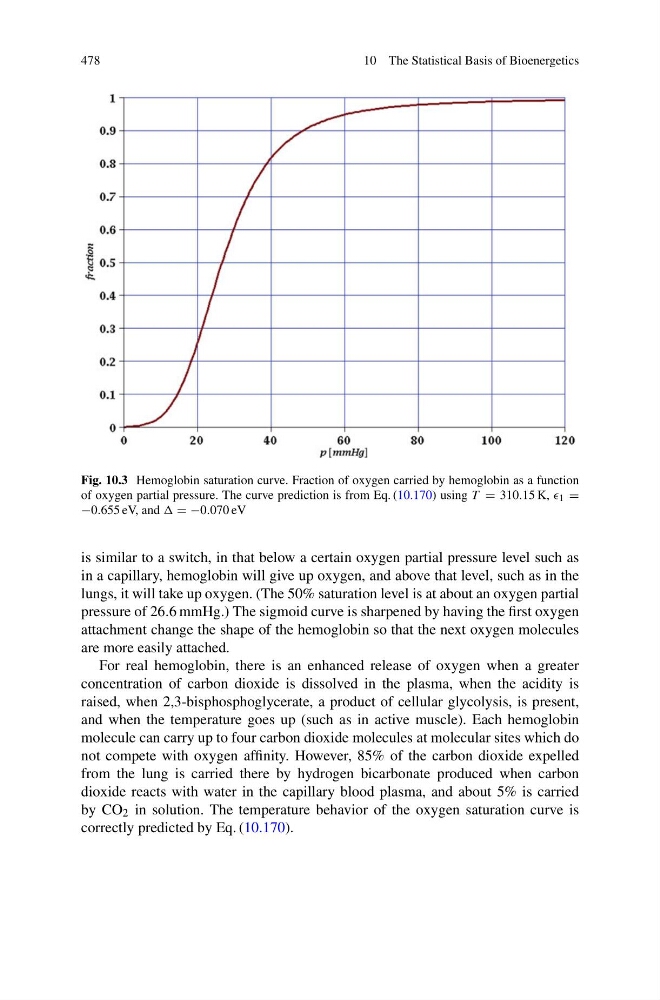
Fig. 10.3 Hemoglobin saturation curve. Fraction of oxygen carried by hemoglobin as a function
of oxygen partial pressure. The curve prediction is from Eq. (10.170) using T = 310.15 K, 1 =
−0.655 eV, and = −0.070 eV
is similar to a switch, in that below a certain oxygen partial pressure level such as
in a capillary, hemoglobin will give up oxygen, and above that level, such as in the
lungs, it will take up oxygen. (The 50% saturation level is at about an oxygen partial
pressure of 26.6 mmHg.) The sigmoid curve is sharpened by having the first oxygen
attachment change the shape of the hemoglobin so that the next oxygen molecules
are more easily attached.
For real hemoglobin, there is an enhanced release of oxygen when a greater
concentration of carbon dioxide is dissolved in the plasma, when the acidity is
raised, when 2,3-bisphosphoglycerate, a product of cellular glycolysis, is present,
and when the temperature goes up (such as in active muscle). Each hemoglobin
molecule can carry up to four carbon dioxide molecules at molecular sites which do
not compete with oxygen affinity. However, 85% of the carbon dioxide expelled
from the lung is carried there by hydrogen bicarbonate produced when carbon
dioxide reacts with water in the capillary blood plasma, and about 5% is carried
by CO 2 in solution. The temperature behavior of the oxygen saturation curve is
correctly predicted by Eq. (10.170).
10 The Statistical Basis of Bioenergetics
Fig. 10.3 Hemoglobin saturation curve. Fraction of oxygen carried by hemoglobin as a function
of oxygen partial pressure. The curve prediction is from Eq. (10.170) using T = 310.15 K, 1 =
−0.655 eV, and = −0.070 eV
is similar to a switch, in that below a certain oxygen partial pressure level such as
in a capillary, hemoglobin will give up oxygen, and above that level, such as in the
lungs, it will take up oxygen. (The 50% saturation level is at about an oxygen partial
pressure of 26.6 mmHg.) The sigmoid curve is sharpened by having the first oxygen
attachment change the shape of the hemoglobin so that the next oxygen molecules
are more easily attached.
For real hemoglobin, there is an enhanced release of oxygen when a greater
concentration of carbon dioxide is dissolved in the plasma, when the acidity is
raised, when 2,3-bisphosphoglycerate, a product of cellular glycolysis, is present,
and when the temperature goes up (such as in active muscle). Each hemoglobin
molecule can carry up to four carbon dioxide molecules at molecular sites which do
not compete with oxygen affinity. However, 85% of the carbon dioxide expelled
from the lung is carried there by hydrogen bicarbonate produced when carbon
dioxide reacts with water in the capillary blood plasma, and about 5% is carried
by CO 2 in solution. The temperature behavior of the oxygen saturation curve is
correctly predicted by Eq. (10.170).